Authors: Wilfahrt P1, Halliday FW2
Reviewers: Barrio IC3, Te Beest M4,5
Measurable unit: damage severity/community load; Measurement scale: plot; Equipment costs: €; Running costs: none; Installation effort: low; Maintenance effort: low; Knowledge need: medium; Measurement mode: manual
Quantifying damage severity on plant organs from invertebrate herbivores and viral, bacterial, and fungal pathogens (herein collectively called plant enemies) helps connect often difficult-to-measure abundances of these enemies to plant community and species dynamics. Changes in enemy damage can reflect bottom-up ecosystem responses to changes in plant diversity resulting from changes in the local environment, such as increased CO2 or temperature (Mitchell et al., 2003; Rúa et al., 2014). Plant enemies can also be directly affected by environmental changes and drive top-down changes to plant hosts due to changes in enemy abundance (Mordecai, 2011; Gillespie et al., 2013) or activity (Barrio et al., 2016). Understanding links between changes to the physical environment and plant-enemy interactions is critical as climate change can cause range expansion or increased abundance of plant enemies (Garrett et al., 2006). This protocol is applicable to other global-change drivers, such as soil eutrophication, as they can also affect the abundance and impacts of natural enemies at the species and community level (Halliday et al., 2019).
4.14.1 What and how to measure?
Damage by pathogens and invertebrate herbivores is typically more localised than that of vertebrate herbivores (Kotanen & Rosenthal, 2000). Vertebrates typically remove entire organs and damage is often quantified at the whole plant scale, as opposed to damage within plant organs that often characterise invertebrate consumers and plant disease. For vertebrate herbivory we refer to protocol 4.15 Vertebrate herbivory. This section focuses on aboveground invertebrate plant damage. Belowground plant enemies are more challenging to assess and are addressed in the subsection 4.14.2 Special cases, emerging issues, and challenges.
Leaf damage
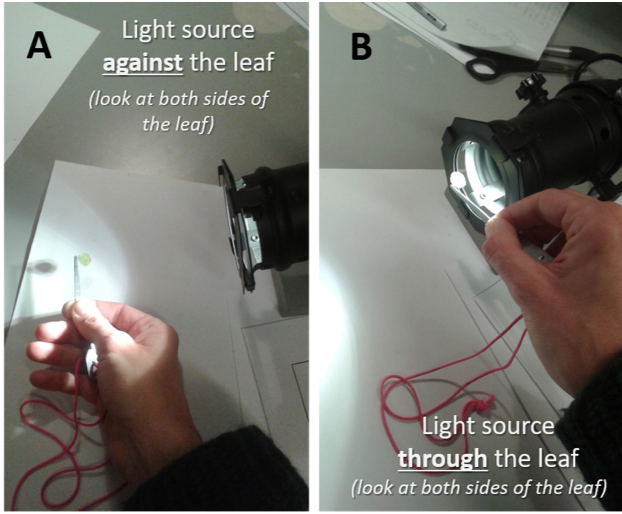
Gold standard. The most commonly assessed plant organs for enemy damage are leaves as they receive the majority of aboveground damage and this type of damage is highly apparent (Barrio et al., 2017). Foliar damage is optimally assessed by collecting fully expanded, moderate-aged leaves from target species, scanning them, and quantifying the percentage of the leaf that has enemy damage using image analysis software (Parker et al., 2015). Leaves should be kept cool and moist during this period to avoid desiccation and shrinkage that will bias results. The percent leaf area with necrosis (cell death), chlorosis (chlorophyll insufficiency), or the area removed or affected by other feeding activities is symptomatic of enemy damage. As a minimum, leaf damage should be partitioned into pathogen and invertebrate herbivory damage, but it is recommended to further partition by damage type listed in Table 4.14.1. Examining a subset of leaves under magnification and with a source of light through and against the leaf surface is recommended to ensure that categorisation into damage type is accurate (Barrio et al., 2017; see Figure 4.14.1). Here, researchers should look for evidence of mechanical damage (e.g. shredding, tearing of plant fibre) that is symptomatic of invertebrate damage, different shaped lesions with differently coloured moulds or powders that are symptomatic of fungal damage, or lesions without coloured moulds or powder that are symptomatic of bacterial or viral lesions (Liu et al., 2016). When none of these signs are evident, chlorosis is likely due to other environmental stresses (e.g. potassium deficiency) and should not be attributed to enemies. The effects of phloem-feeding insects are difficult to quantify, as sucking damage can be nearly impossible to detect. Nonetheless, the effects of these herbivores might be as relevant as other damage types (Kozlov et al., 2015b).
The selection of focal plant species on which to measure damage will depend on the study system. For studies on single plant species or experimental communities that are maintained at specific compositions, a minimum of 20 leaves per species per plot or site should be sampled from different individuals (selected haphazardly) and at different plant heights, or split evenly among individuals when less than 20 individuals are present (Mitchell et al., 2002). Because damage can be strongly determined by leaf age (e.g. Halliday et al., 2017a), leaves should be selected by either stratifying across age classes (e.g. Halliday et al., 2017b) or through a randomisation procedure (e.g. Zvereva & Kozlov, 2019). In certain regions, such as tundra ecosystems, the frequency of damaged leaves is often low, thus larger sample sizes of at least 100 leaves per sampling unit are recommended (Barrio et al., 2017). For studies on natural vegetation, species selection should be based on vegetation cover surveys (see protocol 4.8 Plant community composition). Ideally all species will be sampled, but when species diversity is too great for this to be feasible, rare species can be removed (for example, Heckman et al. (2016) only used species with at least 5% cover in any plot). It should be noted that sampling fewer plant species will likely bias estimations of community damage severity (Zvereva & Kozlov, 2019), as rare species are more likely to avoid enemy damage (Mordecai, 2011) and rarity can arise as a consequence of enemy avoidance (Klironomos, 2002). Additionally, as the number of species sampled increases, it may be sensible to reduce replicate leaves per species, although we recommend never going below 5 leaves per species per plot.
Multiple surveys of permanently marked plants may reveal important components of enemy damage such as rates of herbivory (Anstett et al., 2016) or phenological characteristics and species interactions among plant enemies (Halliday et al., 2017a). Depending on the research questions, the advantages of repeated measurements should be considered, although the time investment can be considerable. As such, we believe single surveys are, in most situations, adequate (Kozlov & Zvereva, 2017) and typically the only option given the destructive method we recommend as the gold standard. When only one damage survey is feasible, it is ideally matched to the peak growing season of the vegetation, unless there is a specific phenological focus of the study (e.g. spring budburst). An additional temporal consideration is that chronic, small-scale enemy damage can have stronger effects in the long-term than a short-term, large-scale enemy damage event (Mitchell, 2003; Zvereva et al., 2012).
Quantifying foliar damage in forest systems presents additional challenges due to the size of individual plants. In cases where significant portions of a tree are visibly damaged, it may be more practical to record foliar damage as a percentage of the individual affected, as opposed to surveying individual leaves (Eichhorn et al., 2016). In this scenario, damage to the crown should be recorded by estimating percent damage in 10% increments (i.e. 0%; 1–10%; 11–20% etc.). In temperate and boreal forest systems, enemy damage for woody species is often recorded at a higher level of specificity for damaging agents than herbaceous species, and you should refer to Tables IV-8 to IV-11 in the ICP Forests Protocol for possible causal agents (Eichhorn et al., 2016).
Bronze standard. When scanning leaves is not an option, visual assessments of the percent of leaf tissue damaged by plant enemies can be estimated in the field. Quantifying percent damage for leaves is frequently aided by digitised images of known severity such as those provided for agricultural crops (James, 1971). When this technique is used, it is critical to have one party sampling all plants to avoid observer bias between samplers (e.g. Johnson et al., 2016). When multiple parties are required, they should “calibrate” their damage estimates on sample plants to avoid this bias as much as possible. Note that because of this bias, this method makes cross-study comparisons such as relative rates of damage inadvisable. Kozlov & Zvereva (2017) found that leaf scanning, measurements with a grid or dot grid method and visual assessment using cover classes yielded statistically indistinguishable estimates when specific plant–insect species herbivory was studied. Nevertheless, we recommend leaf scanning when possible as plant pathogen damage can be difficult to estimate accurately (Cooke, 2006) and scanning is the least subjective method, making between-research group comparisons possible. When visual assessment of percent leaf damage is the chosen method, the value of repeated sampling of leaves should be assessed as discussed above. A last option is to simply record presence or absence of damage on plant leaves, as has been recommended as a rapid assessment tool in other protocols (Meyer et al., 2015). However, we recommend against this when possible, as the loss of information is significant.
Damage to other plant organs
Stem damage is more difficult to assess as a percentage because these organs are generally not functionally two-dimensional like leaves. Thus, for herbaceous systems where stem damage may be important, it is recommended that 20 individuals per species of interest per plot are haphazardly selected and stem damage is recorded as presence/absence and partitioned by damage type when applicable (Roy et al., 2004). Damage prevalence can be calculated as the percentage of individuals showing damage symptoms across the sampled population. Stem damage to trees, however, can be recorded using the same 10% increment classes as crown damage to estimate the average percentage of the stem circumference that is damaged along the entire bole (Eichhorn et al., 2016).
Plant reproductive organs are also susceptible to enemy damage, which can severely reduce plant fitness. Given the high degree of specialisation of inflorescences and seeds, a standardised method for assessing damage severity within such a structure is impractical (Stowe et al., 2000). Instead, damage prevalence can be measured by the percentage of damaged individuals (Abbate & Antonovics, 2014). Within individuals, the percentage of damaged organs can be recorded as a metric for damage severity (e.g. percent flowering tillers with damaged inflorescences, Groppe et al., 2001; percent damaged seeds, Asikainen & Mutikainen, 2005). Accounting for post-dispersal seed loss from invertebrates and pathogens requires experimental approaches that exclude enemies, generally by applying pesticide (Hulme, 1994) or fungicide (Clark & Wilson, 2003) to a known quantity of seeds and comparing post-exposure germination rates to a control. Studies of damage prevalence also pose difficulties. First, reproductive organs are often shorter lived and more variable in seasonal production than stems and leaves (McCall & Irwin, 2006). Thus, frequent surveys are required throughout the reproductive period, especially since certain periods (e.g. flowering) where damage is conspicuous may only last a few days. Second, differentiation between damage to specific reproductive structures is challenging, particularly as consumers may damage multiple structures simultaneously. Furthermore, damage to different reproductive structures, such as anthers v. calyxes, do not equally affect a plant’s reproductive abilities. Collectively, this makes damage surveys of reproductive organs inadvisable at a community level without a high degree of expertise. It is thus advised that damage prevalence of reproductive structures be quantified at a population level only for species with known and observable damage symptoms.
Interpretation
When assessing foliar damage on a single host species, foliar enemy damage can be quantified by calculating damage severity at the plant species level as the average percentage area damaged per leaf. However, because total leaf area varies among plant species, it is inadvisable to compare damage severity among multiple plant species within a community. Instead, severity can be scaled up to the community level for among-host and cross-community comparisons by calculating the community load, which weights damage severity by each plant species’ abundance (Mitchell et al., 2002):
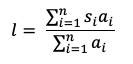
where n is the number of species surveyed, si is the damage severity in the ith species, and ai is the abundance (e.g. cover, biomass) of the ith species. Observed increases in damage severity along a gradient or in response to experimental treatments indicate increased transmission, which could be attributed to factors such as increased host susceptibility or increased abundance or propagule supply of the damaging agent (Keesing et al., 2010). Increases in community load indicate a shift in plant host composition towards more competent host species. However, changes in community load have complicated relationships with plant host richness, where competing mechanisms may result in increased host richness either diluting damage severity (Liu et al., 2016) or amplifying it (Halliday et al., 2017b).
Where to start
Halliday et al. (2019), Kozlov & Zvereva (2017), Mitchell et al. (2002), Mordecai (2011), Parker et al. (2015)
4.14.2 Special cases, emerging issues, and challenges
Species identification of fungal pathogens may be possible in some cases with laboratory microscopy and taxonomic expertise (Liu et al., 2016); otherwise it requires more arduous and costly culturing and sequencing techniques. The identification of microbial species from disease symptoms is challenging. High-throughput sequencing can be used to identify operational taxonomic units (OTUs) in various plant organs, but distinguishing pathogenic from non-pathogenic OTUs is difficult (Turner et al., 2013). For fungal species, fungal colonies can be cultured from diseased plant-organ fragments and fungal mycelia can be subsequently subjected to DNA sequencing and identified through comparison to sequences obtained from known pathogens (Hersh et al., 2012; Nguyen et al., 2016). However, care must still be taken in assigning pathogenic status to these fungi, as non-pathogenic organisms (e.g. saprotrophs) may be associated with observed diseases. Assigning pathogenic status to a single organism with confidence requires fulfilling several conditions derived from Koch’s postulates (Plowright et al., 2008). Even then, some pathogens may remain latent within host tissue long before exhibiting disease symptoms (Photita et al., 2004).
Likewise, invertebrate communities require extensive effort for sampling using vacuum suction, sweep-netting, and pitfall traps (see protocol 4.11 Macroinvertebrate community composition), along with high taxonomic expertise (Siemann, 1998). Functional group identification based on damage type may be more practical when either high effort or taxonomic expertise is not an option (Table 4.14.1). However, quantifying enemy species richness from observed damage is inadvisable because, first, different enemies may cause highly similar damage symptoms (Kozlov et al., 2016) and second, differences in sampling efforts between plots due to differences in plant species richness can strongly misrepresent estimates of enemy richness and require site-based rarefaction (Halliday et al., 2017b).
Assessing the severity and prevalence of belowground plant enemies is highly challenging despite the importance of plant–soil feedbacks in structuring plant communities (Mordecai, 2011). Current alternative approaches include growing plant species in soil that was previously cultivated by conspecifics and comparing performance to soils cultivated by other species (Kulmatiski et al., 2008). This approach can only measure aggregate effects, meaning that potential effects of soil enemies can be masked by soil mutualists. A second approach is to leverage recent advances in sampling the soil microbial community (see protocol 4.9 Soil microbial community composition) and use developing techniques to separate organisms into functional groups that are pathogenic (Aguilar-Trigueros et al., 2014). Even then, this cannot be fully confirmed without rigorous fulfilment of a set of criteria such as Koch’s postulates or some variation thereof (Plowright et al., 2008). In the case of root herbivores, the effects of herbivory may be experimentally manipulated by simulating damage (Zvereva & Kozlov, 2012) or by manipulating herbivore densities (Kozel et al., 2017).
Table 4.14.1 List of plant enemy types and descriptions of most apparent types of damage. Table adapted from ICP-forests protocol.
| Class | Description | Picture |
|
CAUSAL AGENT – MICROBES |
||
| Leaf spot | Small round spots appearing on leaves. Fungal or bacterial. | 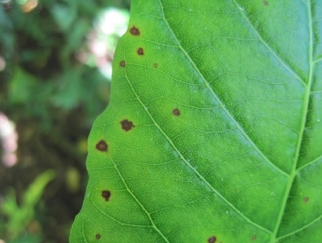 Photo: Erin Mordecai |
| Powdery mildew | White, powdery spots that appear on leaves and stems. Fungal. | 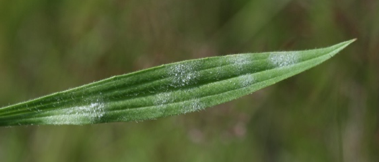 Photo: Anna-Liisa Laine |
| Downy mildew | Yellow patches on the leaf surface that expand and turn brown. Spores are visible under magnification. Fungal. | 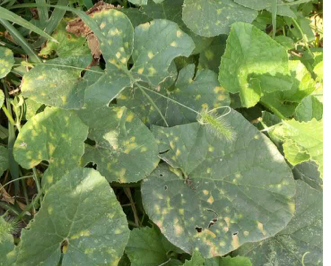 Photo: Yawen Lu |
| Rust | Yellow to red hair-like structures covering leaves and stems. Often easily rubbed off with fingers. Fungal. | 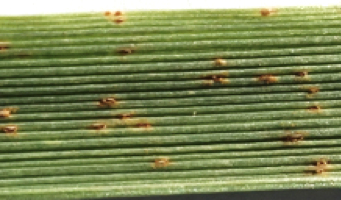 Photo: Kayleigh O’Keefe |
| Blight | A general term for lesions that cause rapid chlorosis which expands and may eventually cause necrosis. Fungal, bacterial, or viral. | 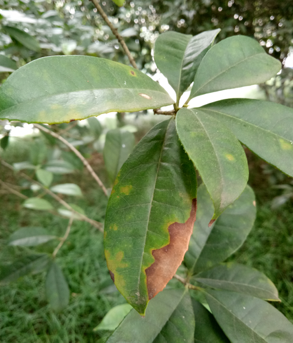
Photo: Xiang Liu |
|
CAUSAL AGENT – INVERTEBRATES |
||
| Skeletonised/
scraping |
Removal of leaf epidermal tissue, causing sections of the leaf to appear translucent.
(Image is of leaf with backlight to help identify damaged areas) |
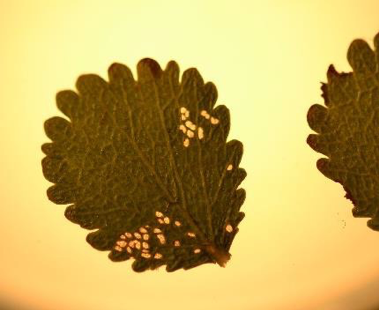 Photo: Isabel Barrio |
| Chewing | Missing segments of leaf either as sporadic spots across the leaf or large sections. | 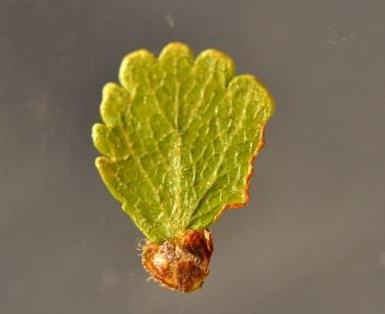 Photo: Isabel Barrio |
| Galling | Abnormal growths on plant tissue. | 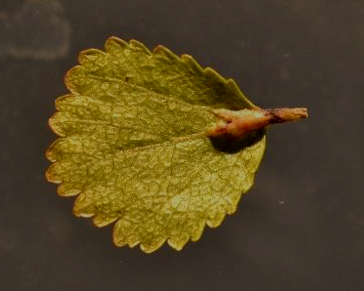 Photo: Isabel Barrio |
| Mining | Visible, unbroken trail on the leaf surface, often moving erratically. | 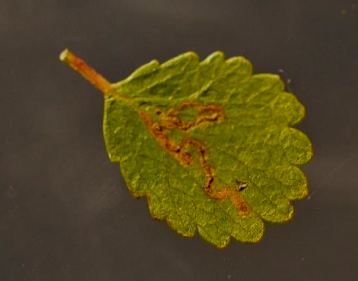
Photo: Isabel Barrio |
4.14.3 References
Theory, significance, and large datasets
Kozlov et al. (2015a), Mitchell et al. (2003), Mordecai (2011), Nguyen et al. (2016)
More on methods and existing protocols
ICP Forests protocol (Eichhorn et al., 2016)
All references
Abbate, J. L., & Antonovics, J. (2014). Elevational disease distribution in a natural plant–pathogen system: insights from changes across host populations and climate. Oikos, 123(9), 1126-1136.
Aguilar-Trigueros, C. A., Powell, J. R., Anderson, I. C., Antonovics, J., & Rillig, M. C. (2014). Ecological understanding of root-infecting fungi using trait-based approaches. Trends in Plant Science, 19(7), 432-438.
Anstett, D. N., Nunes, K. A., Baskett, C., & Kotanen, P. M. (2016). Sources of controversy surrounding latitudinal patterns in herbivory and defense. Trends in Ecology & Evolution, 31(10), 789-802.
Asikainen, E., & Mutikainen, P. (2005). Preferences of pollinators and herbivores in gynodioecious Geranium sylvaticum. Annals of Botany, 95(5), 879-886.
Barrio, I. C., Bueno, C. G., & Hik, D. S. (2016). Warming the tundra: reciprocal responses of invertebrate herbivores and plants. Oikos, 125(1), 20-28.
Barrio, I. C., Lindén, E., Te Beest, M., Olofsson, J., Rocha, A., Soininen, E. M., … Kozlov, M. V. (2017). Background invertebrate herbivory on dwarf birch (Betula glandulosa-nana complex) increases with temperature and precipitation across the tundra biome. Polar Biology, 40(11), 2265-2278.
Clark, D. L., & Wilson, M. V. (2003). Post-dispersal seed fates of four prairie species. American Journal of Botany, 90(5), 730-735.
Cooke, B. (2006). Disease assessment and yield loss. In B. Cooke, D. Jones, & B. Kaye (Eds.), The Epidemiology of Plant Diseases (pp. 43-80). Dordrecht: Springer.
Eichhorn, J., Roskams, P., Potočić, N., Timmermann, V., Ferretti, M., Mues, V., … Wulff, S. (2016). Part IV: Visual Assessment of Crown Condition and Damaging Agents. In UNECE ICP Forests Programme Coordinating Centre (Ed.), Manual on Methods and Criteria for Harmonized Sampling, Assessment, Monitoring and Analysis of the Effects of Air Pollution on Forests. Eberswalde: Thünen Institute of Forest Ecosystems.
Garrett, K. A., Dendy, S. P., Frank, E. E., Rouse, M. N., & Travers, S. E. (2006). Climate change effects on plant disease: genomes to ecosystems. Annual Review of Phytopathology, 44, 489-509.
Gillespie, M. A. K., Jónsdóttir, I. S., Hodkinson, I. D., & Cooper, E. J. (2013). Aphid–willow interactions in a High Arctic ecosystem: responses to raised temperature and goose disturbance. Global Change Biology, 19(12), 3698-3708.
Groppe, K., Steinger, T., Schmid, B., Baur, B., & Boller, T. (2001). Effects of habitat fragmentation on choke disease (Epichloë bromicola) in the grass Bromus erectus. Journal of Ecology, 89(2), 247-255.
Halliday, F. W., Umbanhowar, J., & Mitchell, C. E. (2017a). Interactions among symbionts operate across scales to influence parasite epidemics. Ecology Letters, 20(10), 1285-1294.
Halliday, F. W., Heckman, R. W., Wilfahrt, P. A., & Mitchell, C. E. (2017b). A multivariate test of disease risk reveals conditions leading to disease amplification. Proceedings of the Royal Society B: Biological Sciences, 284(1865), 20171340.
Halliday, F. W., Heckman, R. W., Wilfahrt, P. A., & Mitchell, C. E. (2019). Past is prologue: host community assembly and the risk of infectious disease over time. Ecology Letters, 22(1), 138-148.
Heckman, R. W., Wright, J. P., & Mitchell, C. E. (2016). Joint effects of nutrient addition and enemy exclusion on exotic plant success. Ecology, 97(12), 3337-3345.
Hersh, M. H., Vilgalys, R., & Clark, J. S. (2012). Evaluating the impacts of multiple generalist fungal pathogens on temperate tree seedling survival. Ecology, 93(3), 511-520.
Hulme, P. E. (1994). Post-dispersal seed predation in grassland: its magnitude and sources of variation. Journal of Ecology, 82(3), 645-652.
James, W. C. (1971). An illustrated series of assessment keys for plant diseases, their preparation and usage. Canadian Plant Disease Survey, 51, 39-65
Johnson, M. T. J., Bertrand, J. A. & Turcotte, M. M. (2016). Precision and accuracy in quantifying herbivory. Ecological Entomology, 41(1), 112-121.
Keesing, F., Belden, L. K., Daszak, P., Dobson, A., Harvell, C. D., Holt, R. D., … Myers, S. S. (2010). Impacts of biodiversity on the emergence and transmission of infectious diseases. Nature, 468(7324), 647-652.
Klironomos, J. N. (2002). Feedback with soil biota contributes to plant rarity and invasiveness in communities. Nature, 417(6884), 67.
Kotanen, P. M., & Rosenthal, J. P. (2000). Tolerating herbivory: does the plant care if the herbivore has a backbone? Evolutionary Ecology, 14, 537–549
Kozel, A. V., Zvereva, E. L., & Kozlov, M. V. (2017). Impacts of root herbivory on seedlings of three species of boreal forest trees. Applied Soil Ecology, 117-118, 203-207
Kozlov, M. V., & Zvereva, E. L. (2017). Background insect herbivory: impacts, patterns and methodology. Progress in Botany, 79, 313-355.
Kozlov, M. V., Lanta, V., Zverev, V., & Zvereva, E. L. (2015a). Global patterns in background losses of woody plant foliage to insects. Global Ecology and Biogeography, 24(10), 1126-1135.
Kozlov, M. V., Stekolshchikov, A. V., Söderman, G., Labina, E. S., Zverev, V., & Zvereva, E. L. (2015b). Sap‐feeding insects on forest trees along latitudinal gradients in northern Europe: a climate‐driven patterns. Global Change Biology, 21(1), 106-116.
Kozlov, M. V., Skoracka, A., Zverev, V., Lewandowski, M. & Zvereva, E. L. (2016). Two birch species demonstrate opposite latitudinal patterns in infestation by gall-making mites in Northern Europe. PLoS ONE, 11(11), e0166641.
Kulmatiski, A., Beard, K. H., Stevens, J. R., & Cobbold, S. M. (2008). Plant–soil feedbacks: a meta‐analytical review. Ecology Letters, 11(9), 980-992.
Liu, X., Lyu, S., Zhou, S., & Bradshaw, C. J. (2016). Warming and fertilization alter the dilution effect of host diversity on disease severity. Ecology, 97(7), 1680-1689.
McCall, A. C., & Irwin, R. E. (2006). Florivory: the intersection of pollination and herbivory. Ecology Letters, 9(12), 1351-1365.
Meyer, S. T., Koch, C., & Weisser, W. W. (2015). Towards a standardized rapid ecosystem function assessment (REFA). Trends in Ecology & Evolution, 30(7), 390-397.
Mitchell, C. E. (2003). Trophic control of grassland production and biomass by pathogens. Ecology Letters, 6(2), 147-155.
Mitchell, C. E., Tilman, D., & Groth, J. V. (2002). Effects of grassland plant species diversity, abundance, and composition on foliar fungal disease. Ecology, 83(6), 1713-1726.
Mitchell, C. E., Reich, P. B., Tilman, D., & Groth, J. V. (2003). Effects of elevated CO2, nitrogen deposition, and decreased species diversity on foliar fungal plant disease. Global Change Biology, 9(3), 438-451.
Mordecai, E. A. (2011). Pathogen impacts on plant communities: unifying theory, concepts, and empirical work. Ecological Monographs, 81(3), 429-441.
Nguyen, N. H., Song, Z., Bates, S. T., Branco, S., Tedersoo, L., Menke, J., … Kennedy, P. G. (2016). FUNGuild: an open annotation tool for parsing fungal community datasets by ecological guild. Fungal Ecology, 20, 241-248.
Parker, I. M., Saunders, M., Bontrager, M., Weitz, A. P., Hendricks, R., Magarey, R., … Gilbert, G. S. (2015). Phylogenetic structure and host abundance drive disease pressure in communities. Nature, 520(7548), 542-544.
Photita, W., Lumyong, S., Lumyong, P., McKenzie, E. H. C., & Hyde, K. D. (2004). Are some endophytes of Musa acuminata latent pathogens? Fungal Diversity, 16, 131-140.
Plowright, R. K., Sokolow, S. H., Gorman, M. E., Daszak, P., & Foley, J. E. (2008). Causal inference in disease ecology: investigating ecological drivers of disease emergence. Frontiers in Ecology and the Environment, 6(8), 420-429.
Roy, B. A., Güsewell, S., & Harte, J. (2004). Response of plant pathogens and herbivores to a warming experiment. Ecology, 85(9), 2570-2581.
Rúa, M. A., McCulley, R. L., & Mitchell, C. E. (2014). Climate drivers, host identity and fungal endophyte infection determine virus prevalence in a grassland ecosystem. Journal of Ecology, 102(3), 690-699.
Siemann, E. (1998). Experimental tests of effects of plant productivity and diversity on grassland arthropod diversity. Ecology, 79(6), 2057-2070.
Stowe, K. A., Marquis, R. J., Hochwender, C. G., & Simms, E. L. (2000). The evolutionary ecology of tolerance to consumer damage. Annual Review of Ecology and Systematics, 31(1), 565-595.
Turner, T. R., James, E. K., & Poole, P. S. (2013). The plant microbiome. Genome Biology, 14(6), 209.
Zvereva, E. L., & Kozlov, M. V. (2012). Sources of variation in plant responses to belowground insect herbivory: a meta-analysis. Oecologia, 169, 441-452.
Zvereva, E. L., & Kozlov, M. V. (2019). Biases in studies of spatial patterns in insect herbivory. Ecological Monographs, e01361.
Zvereva, E. L., Zverev, V., & Kozlov, M. V. (2012). Little strokes fell great oaks: minor but chronic herbivory substantially reduces birch growth. Oikos, 121(12), 2036-2043.
Authors: Wilfahrt P1, Halliday FW2
Reviewers: Barrio IC3, Te Beest M4,5
Affiliations
1 Department of Disturbance Ecology, BayCEER, University of Bayreuth, Bayreuth, Germany
2 Department of Biology, University of North Carolina, Chapel Hill, USA
3 Department of Natural Resources and Environmental Sciences, Agricultural University of Iceland, Reykjavík, Iceland
4 Environmental Sciences, Copernicus Institute of Sustainable Development, Utrecht University, Utrecht, the Netherlands
5 Centre for African Conservation Ecology, Nelson Mandela University, Port Elizabeth, South Africa