Authors: Radujković D1, Verbruggen E1
Reviewer: Vik U2
Measurable unit: number and relative abundance of microbial taxa; Measureable scale: plot; Equipment costs: €€; Running costs: €€; Installation effort: medium; Maintenance effort: -; Knowledge need: medium to high; Measurement mode: manual
The microbial community composition represents the number and relative abundance of microbial taxa in a given system. This measure provides insight into the diversity and variability of the relative abundances of microbial taxa and thus aspects of their community dynamics. Moreover, changes in overall soil microbial community composition may point to corresponding changes in the various processes in which these communities are involved (Zogg et al., 1997; Balser & Firestone, 2005; Strickland et al., 2009). Microbes in soil are essential for decomposition of organic matter (Allison & Martiny, 2008), they can play a key role in long-term carbon storage (Clemmensen et al., 2013), and they are important drivers of biogeochemical cycling processes, including carbon and nitrogen cycling (Prosser et al., 2007; Falkowski et al., 2008). Specific microbial functional groups (such as nitrifying bacteria, mycorrhizal fungi, plant parasites) may affect ecosystem functioning by altering nutrient availability or plant productivity (van der Heijden et al., 2008). Mycorrhizal fungi, for example, are associated with up to 90% of terrestrial plants (Smith & Read, 2008) and they could have important effects on plant productivity (Wilson et al., 2016; Yang et al., 2016) and carbon dynamics in soil. It has been demonstrated that changes in different environmental factors (e.g. precipitation, CO2, temperature, nutrient concertation) can cause shifts in microbial community composition (Zogg et al., 1997; Castro et al., 2010; Nemergut et al., 2014). These changes may, directly or indirectly, affect important ecosystem process (e.g. carbon cycling), thereby mediating the feedback responses to global change (Davidson & Janssens, 2006; Pold & DeAngelis, 2013).
4.9.1 What and how to measure?
Gold standard
With the development of high-throughput DNA sequencing techniques, the composition of soil microbial communities can be studied in more detail at a lower cost than using traditional culture-dependent approaches (Shokralla et al., 2012). High-throughput molecular identification of microbial communities requires the isolation of nucleic acids from environmental samples, followed by DNA amplification using primers (small manufactured sections of DNA) that bind specifically to phylogenetically conserved regions of genes, which flank so called barcode markers (Winsley et al., 2012). The accuracy of these analyses are strongly dependent on the choice of primers (Klindworth et al., 2013). Genes encoding components of the nuclear ribosomal units (small subunit, SSU; large subunit, LSU; internal transcribed spacer, ITS) are by far the most commonly used genetic markers for taxonomic identification of microorganisms (Lindahl et al., 2013). Current high-throughput sequencing techniques allow the simultaneous sequencing of millions of reads (Bartram et al., 2011), which are then clustered into operational taxonomic units (OTUs; typically at 97% sequence similarity) and assigned to taxonomic/functional groups using various bioinformatical tools and reference databases. The changes in microbial community composition exposed to certain climate treatments (e.g. warming, drought) compared to control communities, can be statistically assessed based on the differences in the number and relative abundance of OTUs between these communities and/or changes in relative abundance of taxonomic/functional groups.
Bronze standard
Phospholipid fatty acid analysis (PLFA) is another culture-independent method that is commonly used to assess the changes in microbial community composition. It has been demonstrated that PLFA analyses and genetic sequencing can detect similar overall patterns in bacterial community composition (Orwin et al., 2018). Compared to genetic sequencing, PLFA has a very limited taxonomic resolution, especially for groups other than bacteria, but unlike sequencing it can provide quantitative information about microbial biomass (Brewer et al., 2015). It can thus be preferred in cases when quantitative shifts in both biomass and broad functional groups (fungi, gram-positive v. gram-negative bacteria) are to be delineated. For a detailed protocol and possible applications of PLFA see Frostegård et al. (1993) and Frostegård et al. (2011), respectively.
Soil sampling and storage
Soil samples are collected using soil corers, usually at depths of 0–5 cm and/or 5–10 cm (e.g. Rinnan et al., 2007; Kuffner et al., 2012; Hayden et al., 2012). The corers must be cleaned between the samples in order to avoid cross-contamination. When collecting samples for fungal analysis, it should be borne in mind that fungi can have very long mycelia and thus it is recommended to keep a minimal distance of 3 m between different samples when independence is required for statistical analysis (Lindahl et al., 2013). Typically, a few soil samples (e.g. for a good representation of a plot, samples can be taken in four corners and the centre). Depending on the study question, samples can be taken one time only (e.g. in the peak of the growing season, if the aim is to examine the effect of treatments at the peak of vegetation growth) or multiple times in the same plot (e.g. if the aim is to examine inter- or intra-annual changes in community composition). The samples can be stored in sterile plastic ziplock bags. After sampling, the soil is sieved (2 mm mesh size is a standard in soil science), taking care to prevent contamination. The samples should be kept in a cold place and processed as soon as possible to avoid the degradation of DNA and microbial growth (Rochelle et al., 1994). Over longer time periods, samples can be optimally stored by freezing at -20 °C or -80 °C (Song et al., 2016). Alternatively, they can be freeze-dried (Lindahl et al., 2013) or stored in pure ethanol (Hale et al., 2015) or commercially available preservation solutions.
DNA extraction
Most extraction methods are based on direct cell lysis which generally provides high yields of DNA with relatively short processing times (Robe et al., 2003). Commercially available soil DNA extraction kits provide detailed protocols for extraction procedures. Because of the typical low sample size for extraction (0.25–0.5 g dry weight) care should be taken to thoroughly homogenise material for subsampling, or isolate DNA from multiple technical replicates. Ideally, extraction should yield high and uniform amounts of DNA and minimal concentrations of amplification inhibitors (Lindahl et al., 2013). DNA yield can be assessed and concentrations can be adjusted through dilution. The same DNA extraction protocol should be used for all samples (Tedersoo et al., 2010) ensuring that potential extraction-related biases are equally distributed across all samples.
The procedures described next are sometimes outsourced to a commercial laboratory (even including taxonomic annotation of obtained sequences), or can be performed in-house when facilities are available.
DNA amplification – PCR
Following extraction, DNA is amplified using primers that target a barcode marker region which is conserved within a particular microbial group (prokaryotes, eukaryotes, fungi, arbuscular mycorrhizal fungi), but includes variable regions that allow the distinction at the phylogenetic level of interest (Lindahl et al., 2013). The primers also include artificial barcode sequences that allow identification of different samples after sequencing, or these barcodes are added in a second step. Amplification of the marker is accomplished by successful binding of the two primers to the flanking sections, and generating copies of it through a “polymerase chain reaction” (PCR). In order to assess the variation resulting from stochastic processes during laboratory work, replicate PCR reactions can be performed using independently obtained DNA extractions from the same sample (Kauserud, et al., 2012). PCR conditions (see e.g. Bartram et al., 2011; Klindworth et al., 2013; Zhang et al., 2016) need to be optimised to the marker region and lab conditions (e.g. enzymes and thermal cycler), where the annealing temperature in particular deserves attention. Optimal annealing temperatures between 45 and 68 °C differ depending on primer sequence and length and are, as a rule of thumb, set at 5 °C below the calculated temperature of the lowest primer melting point (Tm) (Roux, 2009).
To assess the success of a PCR, the products are visualised on an agarose gel where presence and length of a product can be determined. If the annealing temperature is too low (primers do not anneal specifically to the target region) there will be more bands visible on the gel (more than expected based on natural length variation of the marker); if it is too high (primers do not anneal to target region at all) there will be no bands on the gel. The optimal annealing temperature for a particular primer pair can be determined by gradually increasing the annealing temperature (gradient PCR). PCRs can also fail due to different inhibitors present in the starting template. A 5–100-fold dilution of the template may dilute out the inhibitor (Roux, 2009). Other possible solutions in case of PCR failure include re-extraction, re-amplification, ethanol precipitation, changing the number of PCR cycles, or adding stabilising proteins such as bovine serum albumin (BSA) (see Roux, 2009 for more details on optimisation of PCR process).
Primer choice
There are multiple valid reasons to choose one primer-pair over another for a particular group of microbes. Main reasons are i) the sequencing technology used: some instruments (e.g. Illumina Miseq) work optimally with DNA sequences between 250–500 base pairs (bp) in length, while others (e.g. PacBio) can sequence whole DNA strands with thousands of bp; ii) sequence variability: ideally there should be a so called “barcode-gap” (Schoch et al., 2012) making it easy to delineate within-species v. between-species variability, however this varies between taxonomic groups and markers and so choice will often be a trade-off where higher quality data for one group will come at a cost of another; and iii) historical reasons will cause a marker for a group of interest to have a much better representation in databases (e.g. 16S/18S rRNA for many microbial groups), which means that even when in principle other regions would be more suitable, having a well-filled database to compare against will improve the quality of the eventual data.
Bacteria. The 16S rRNA gene (encodes SSU in prokaryotes) has been by far the most commonly used genetic marker for analyses of bacterial communities (Klindworth et al., 2013) for a number of reasons: it is present in all bacteria; it contains both highly conserved regions and hypervariable regions; and it is sufficiently long (1,500 bp) for bioinformatic purposes (Janda & Abbott, 2007). The combination of Bakt_341F and Bakt_805R primers (Herlemann et al., 2011) can be used to amplify variable regions V3 and V4 of 16s rRNA gene. This primer set was evaluated by Klindworth et al. (2013) as one of the most efficient in amplifying a wide range of bacterial phyla.
Fungi. Molecular analyses of fungal communities mainly rely on amplification of the ITS region (spanning the ITS1, 5.8S, and ITS2 regions), which was selected as the universal genetic barcode for fungi (Schoch et al., 2012). However, whether the ITS1, ITS2, or a combination of these two regions is better suited for characterisation of fungal communities is still under debate (Blaalid et al., 2013). The ITS1 region is frequently amplified using the combination of IT1f and ITS2 primers (Op De Beeck et al., 2014; Smith & Peay, 2014). fITS7, gITS7, and fITS9 primers target binding sites in the 5.8S region and together with the ITS4 primer, they can be used to amplify the ITS2 region (Ihrmark et al., 2012). The combination of ITS1f and ITS4 primers span both ITS regions together with 5.8S region (Smith & Peay, 2014).
Arbuscular mycorrhizal fungi (AMF) – Glomeromycota. For AMF analysis, the most commonly used marker region is SSU (18S rDNA in eukaryotes), followed by LSU(28S rDNA) and ITS rDNA region (Öpik et al., 2014). The SSU rDNA region alone is not suitable for identification of species (Öpik et al., 2014), but in the cases when species resolution is not the primary goal, primers that target SSU region, for example AML1 and ALM2, designed by Lee et al. (2008), can provide useful information regarding the overall AMF community composition. Primer set SSUmAf–LSUmAr (1800 bp) and SSUmCf–LSUmBr (1500 bp) developed by Krüger et al. (2009) spans a fragment covering the partial SSU, the entire ITS, and the partial LSU rDNA region. This combination of primers enables detection of additional AMF, but the sequences are too long for some high-throughput sequencing and alternative sequencing methods must be used (Schlaeppi et al., 2016).
Protists. A comprehensive overview of different SSU primers designed to target protists is provided by Adl et al. (2014). However, Adl et al. (2014) conclude that none of the examined primers had a high specificity at taxonomic levels higher than genus. The combination of primers TAReuk454FWD1 and TAReukREV3 (Stoeck et al., 2010) that targets the V4 region of SSU, can be used for detection of a wide range of eukaryotic lineages (Mahé et al., 2017). A recently developed combination of primers (ITS3 primer mixes, ITS4ngs) described in Tedersoo et al. (2015) that target ITS2 region can be used to characterise certain protist groups: Cercozoa, Ciliophora, and Chlorophyta, as well as soil animals (Acari, Nematoda, Collembola, Rotifera, Annelida) which are thought to be the most abundant and species-rich eukaryotic taxa in soil (Tedersoo et al., 2015). Given the paraphyletic nature of protists (spanning the entire eukaryotic phylogenetic tree), no primers specifically targeting this group as a whole can be designed. For this reason, samples containing a high concentration of plant, fungal, or animal DNA, such as when one aims to elucidate the protists that are part of their “microbiomes”, are at risk of primarily generating non-target sequences.
Library preparation and sequencing
Following purification from PCR artefacts (primers and primer-dimers), different samples with specific barcodes are equimolarly pooled into a single library ready for sequencing. The Illumina MiSeq platform (Illumina Inc; San Diego, CA, USA) is currently the most commonly used platform for high-throughput sequencing of environmental microbial samples. This platform enables sequencing of 200–550 bp-long paired-end reads (forward and reverse) which is, in most cases, enough to cover the entire marker region for different microbial groups. Longer reads can be sequenced using single molecule real-time (SMRT) methodology (PacBio; Manlo Park, CA, USA).
Quality control and bioinformatics analyses
UPARSE (Edgar, 2013), QIIME (Caporaso et al., 2010), and mothur (Schloss et al., 2009) are some of the most commonly used bioinformatics pipelines that allow quality filtering and construction of OTUs from next-generation sequencing reads. The main result of these analyses is an OTU table (Figure 4.9.1). The downstream analyses (e.g. standardisation of read number through downsampling (Weiss et al., 2017), calculation of alpha and beta diversity) can be performed using QIIME and mothur, but also in statistical programs such as R (e.g. using the ‘vegan’ or ‘phyloseq’ packages). Typically, OTU tables are used to create distance matrices, which include pairwise distances between the microbial communities of different samples (Figure 4.9.1). It should be noted that for bacterial sequences, it is common to create phylogenetic trees and use phylogenetically informed distance metrics (i.e. UniFrac). Statistical analyses on distance matrices or OTU tables can be performed using various multivariate types of analyses such as perMANOVA, ANOSIM, and ordination methods (e.g. PCoA, (G)NMDS, CCA, an example is depicted in Figure 4.9.1).
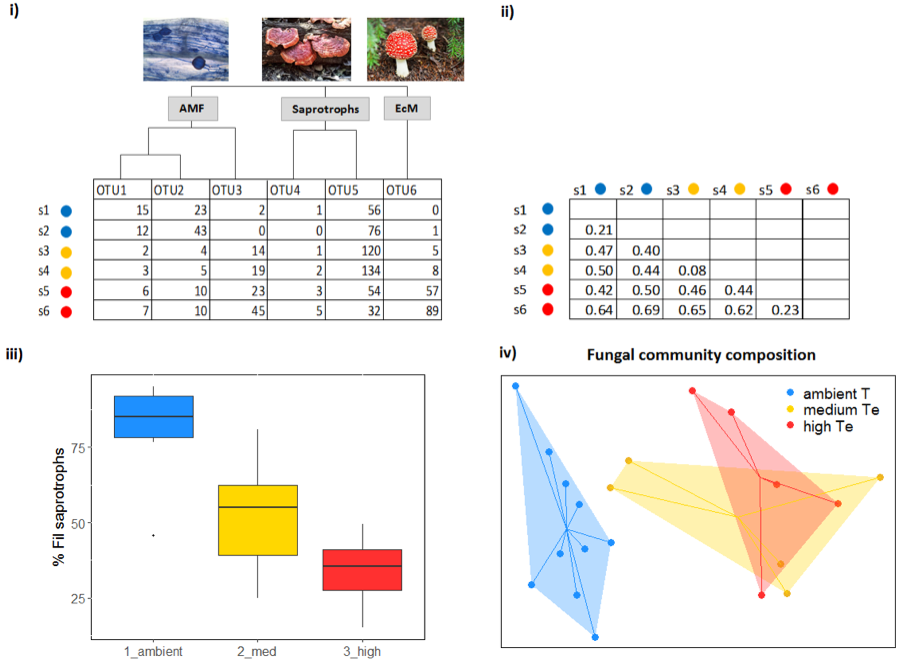
Taxonomic identification is performed by aligning sequences to the reference sequences (using BLAST or other methods implemented in UPARSE/QIIME/mothur) deposited in publicly available databases. An overview of different databases is given by Santamaria et al. (2012). For instance, the Greengenes database contains a collection of bacterial 16s rDNA sequences (DeSantis et al., 2006), UNITE is a comprehensive reference database for fungal ITS sequences (Abarenkov et al., 2010), and PR2 (Protist Ribosomal Reference) database is suitable for annotation of protist SSU sequences (Guillou et al., 2013). Other databases, such as Silva (Quast et al., 2013) and Ribosomal Database Project (Cole et al., 2014) contain collections of SSU and LSU sequences for various groups of prokaryotic and eukaryotic microorganisms. Following the taxonomic assignment, fungal OTUs can also be assigned to different functional categories (i.e. saprotrophic fungi, white rot decomposers, yeasts, plant pathogens, mycoparasites, animal parasites, arbuscular mycorrhizal fungi – AMF, ectomycorrhizal fungi – EcM) by matching their genus/family level with the known lifestyles (e.g. as in Tedersoo et al., 2014) using specialised tools such as FUNGuild (Nguyen et al., 2016).
Where to start
Bartram et al. (2011), Lindahl et al. (2013), Roux (2009), Shokralla et al. (2012), Tedersoo et al. (2010)
4.9.2 Special cases, emerging issues, and challenges
The methods of molecular analysis of microbial communities are evolving very rapidly with the development of new technologies. Previously commonly used 454 pyrosequencing is now almost entirely replaced by Illumina sequencing by synthesis. SMRT technology, such as PacBio, is now being increasingly used since it can provide longer reads (albeit with high error rates). The choice of sequencing platform is therefore currently a trade-off between the quality of the produced reads and the maximum length of the reads (Kennedy et al., 2018), but these or other platforms will likely become cost-efficient at low error rates in the near future.
Recently, there has been a lot of discussion regarding the common practices for bioinformatics analysis of sequencing data. The conventional approach is to perform clustering of OTUs, usually based on 97% similarity. However, this approach has been challenged and it has been proposed that instead of OTU clustering, amplicon sequence variants (ASVs) should be used. It is argued that, compared to OTUs, ASVs represent a biological reality independent of the data analysis, they have a better taxonomic resolution, they can be validly compared across different studies, and they are not limited by incomplete reference databases (Callahan et al., 2017). However, ASVs are highly sensitive to the quality of the data and this approach could be problematic for downstream analysis due to significantly increased diversity. While OTU clustering still remains the most common approach, it would be useful to also report the sequence variants in order to enable the effective comparison between different studies.
4.9.3 References
Theory, significance, and large datasets
Allison & Martiny (2008), Falkowski et al. (2008), Smith & Read (2008), van der Heijden et al. (2008), Zogg et al. (1997)
More on methods and existing protocols
Adl et al. (2014), Ihrmark et al. (2012), Klindworth et al. (2013), Op De Beeck et al. (2014), Smith & Peay (2014)
All references
Abarenkov, K., Henrik Nilsson, R., Larsson, K.-H., Alexander, I. J., Eberhardt, U., Erland, S., … Kõljalg, U. (2010). The UNITE database for molecular identification of fungi – recent updates and future perspectives. New Phytologist, 186(2), 281-285.
Adl, S. M., Habura, A., & Eglit, Y. (2014). Amplification primers of SSU rDNA for soil protists. Soil Biology and Biochemistry, 69, 328-342.
Allison, S. D., & Martiny, J. B. (2008). Resistance, resilience, and redundancy in microbial communities. Proceedings of the National Academy of Sciences USA, 105(Supplement 1), 11512-11519.
Bartram, A. K., Lynch, M. D. J., Stearns, J. C., Moreno-Hagelsieb, G., & Neufeld, J. D. (2011). Generation of multimillion-sequence 16S rRNA gene libraries from complex microbial communities by assembling paired-end Illumina reads. Applied and Environmental Microbiology, 77(11), 3846-3852.
Balser, T. C., & Firestone, M. K. (2005). Linking microbial community composition and soil processes in a California annual grassland and mixed-conifer forest. Biogeochemistry, 73(2), 395-415.
Blaalid, R., Kumar, S., Nilsson, R. H., Abarenkov, K., Kirk, P. M., & Kauserud, H. (2013). ITS1 versus ITS2 as DNA metabarcodes for fungi. Molecular Ecology Resources, 13(2), 218-224.
Brewer, S., Techtmann, S. M., Mahmoudi, N., Niang, D., Pfiffner, S., & Hazen, T. C. (2015). Co-extraction of DNA and PLFA from soil samples. Journal of Microbiological Methods, 115, 64-66.
Callahan, B. J., McMurdie, P. J., & Holmes, S. P. (2017). Exact sequence variants should replace operational taxonomic units in marker-gene data analysis. The ISME journal, 11(12), 2639.
Caporaso, J. G., Kuczynski, J., Stombaugh, J., Bittinger, K., Bushman, F. D., Costello, E. K., … Knight, R. (2010). QIIME allows analysis of high-throughput community sequencing data. Nature Methods, 7(5), 335-336.
Castro, H. F., Classen, A. T., Austin, E. E., Norby, R. J., & Schadt, C. W. (2010). Soil microbial community responses to multiple experimental climate change drivers. Applied and Environmental Microbiology, 76(4), 999-1007.
Clemmensen, K. E., Bahr, A., Ovaskainen, O., Dahlberg, A., Ekblad, A., Wallander, H., … Lindahl, B. D. (2013). Roots and associated fungi drive long-term carbon sequestration in boreal forest. Science, 339(6127), 1615-1618.
Cole, J. R., Wang, Q., Fish, J. A., Chai, B., McGarrell, D. M., Sun, Y., … Tiedje, J. M. (2014). Ribosomal Database Project: data and tools for high throughput rRNA analysis. Nucleic Acids Research, 42(D1), D633-D642.
Davidson, E. A., & Janssens, I. A. (2006). Temperature sensitivity of soil carbon decomposition and feedbacks to climate change. Nature, 440(7081), 165-173.
DeSantis, T. Z., Hugenholtz, P., Larsen, N., Rojas, M., Brodie, E. L., Keller, K., … Andersen, G. L. (2006). Greengenes, a chimera-checked 16S rRNA gene database and workbench compatible with ARB. Applied and Environmental Microbiology, 72(7), 5069-5072.
Edgar, R. C. (2013). UPARSE: highly accurate OTU sequences from microbial amplicon reads. Nature Methods, 10(10), a2604.
Falkowski, P. G., Fenchel, T., & Delong, E. F. (2008). The microbial engines that drive Earth’s biogeochemical cycles. Science, 320(5879), 1034-1039.
Frostegård, Å., Tunlid, A., & Bååth, E. (1993). Phospholipid fatty acid composition, biomass, and activity of microbial communities from two soil types experimentally exposed to different heavy metals. Applied and Environmental Microbiology, 59(11), 3605-3617.
Frostegård, Å., Tunlid, A., & Bååth, E. (2011). Use and misuse of PLFA measurements in soils. Soil Biology and Biochemistry, 43(8), 1621-1625.
Guillou, L., Bachar, D., Audic, S., Bass, D., Berney, C., Bittner, L., … Christen, R. (2013). The Protist Ribosomal Reference database (PR2): a catalog of unicellular eukaryote small sub-unit rRNA sequences with curated taxonomy. Nucleic Acids Research, 41(Database issue), D597-604.
Hale, V. L., Tan, C. L., Knight, R., & Amato, K. R. (2015). Effect of preservation method on spider monkey (Ateles geoffroyi) fecal microbiota over 8 weeks. Journal of Microbiological Methods, 113, 16-26.
Hayden, H. L., Mele, P. M., Bougoure, D. S., Allan, C. Y., Norng, S., Piceno, Y. M., … Hovenden, M. J. (2012). Changes in the microbial community structure of bacteria, archaea and fungi in response to elevated CO2 and warming in an Australian native grassland soil. Environmental Microbiology, 14(12), 3081-3096.
Herlemann, D. P., Labrenz, M., Jürgens, K., Bertilsson, S., Waniek, J. J., & Andersson, A. F. (2011). Transitions in bacterial communities along the 2000 km salinity gradient of the Baltic Sea. The ISME Journal, 5(10), 1571-1579.
Ihrmark, K., Bödeker, I. T. M., Cruz-Martinez, K., Friberg, H., Kubartova, A., Schenck, J., … Lindahl, B. D. (2012). New primers to amplify the fungal ITS2 region – evaluation by 454-sequencing of artificial and natural communities. FEMS Microbiology Ecology, 82(3), 666-677.
Janda, J. M., & Abbott, S. L. (2007). 16S rRNA gene sequencing for bacterial identification in the diagnostic laboratory: pluses, perils, and pitfalls. Journal of clinical microbiology, 45(9), 2761-2764.
Kauserud, H., Kumar, S., Brysting, A. K., Nordén, J., & Carlsen, T. (2012). High consistency between replicate 454 pyrosequencing analyses of ectomycorrhizal plant root samples. Mycorrhiza, 22(4), 309-315.
Kennedy, P. G., Cline, L. C., & Song, Z. (2018). Probing promise versus performance in longer read fungal metabarcoding. New Phytologist, 217(3), 973-976.
Klindworth, A., Pruesse, E., Schweer, T., Peplies, J., Quast, C., Horn, M., & Glockner, F. O. (2013). Evaluation of general 16S ribosomal RNA gene PCR primers for classical and next-generation sequencing-based diversity studies. Nucleic Acids Research, 41(1), e1.
Krüger, M., Stockinger, H., Krüger, C., & Schüßler, A. (2009). DNA‐based species level detection of Glomeromycota: one PCR primer set for all arbuscular mycorrhizal fungi. New Phytologist, 183(1), 212-223.
Kuffner, M., Hai, B., Rattei, T., Melodelima, C., Schloter, M., Zechmeister-Boltenstern, S., … Sessitsch, A. (2012). Effects of season and experimental warming on the bacterial community in a temperate mountain forest soil assessed by 16S rRNA gene pyrosequencing. FEMS Microbiology Ecology, 82(3), 551-562.
Lee, J., Lee, S., & Young, J. P. W. (2008). Improved PCR primers for the detection and identification of arbuscular mycorrhizal fungi. FEMS Microbiology Ecology, 65(2), 339-349.
Lindahl, B. D., Nilsson, R. H., Tedersoo, L., Abarenkov, K., Carlsen, T., Kjøller, R., … Kauserud, H. (2013). Fungal community analysis by high-throughput sequencing of amplified markers – a user’s guide. New Phytologist, 199(1), 288-299.
Mahé, F., de Vargas, C., Bass, D., Czech, L., Stamatakis, A., Lara, E., … Dunthorn, M. (2017). Parasites dominate hyperdiverse soil protist communities in Neotropical rainforests. Nature Ecology & Evolution, 1, 91.
Nemergut, D. R., Shade, A., & Violle, C. (2014). When, where and how does microbial community composition matter? Frontiers in Microbiology, 5, 497.
Nguyen, N. H., Song, Z., Bates, S. T., Branco, S., Tedersoo, L., Menke, J., … Kennedy, P. G. (2016). FUNGuild: An open annotation tool for parsing fungal community datasets by ecological guild. Fungal Ecology, 20, 241-248.
Op De Beeck, M., Lievens, B., Busschaert, P., Declerck, S., Vangronsveld, J., & Colpaert, J. V. (2014). Comparison and validation of some ITS primer pairs useful for fungal metabarcoding studies. PLoS One, 9(6), e97629.
Öpik, M., Davison, J., Moora, M., & Zobel, M. (2014). DNA-based detection and identification of Glomeromycota : the virtual taxonomy of environmental sequences. Botany, 92(2), 135-147.
Orwin, K. H., Dickie, I. A., Holdaway, R., & Wood, J. R. (2018). A comparison of the ability of PLFA and 16S rRNA gene metabarcoding to resolve soil community change and predict ecosystem functions. Soil Biology and Biochemistry, 117, 27-35.
Pold, G., & DeAngelis, K. M. (2013). Up against the wall: the effects of climate warming on soil microbial diversity and the potential for feedbacks to the carbon cycle. Diversity, 5(2), 409-425.
Prosser, J. I., Bohannan, B. J., Curtis, T. P., Ellis, R. J., Firestone, M. K., Freckleton, R. P., … Osborn, A. M. (2007). The role of ecological theory in microbial ecology. Nature Reviews Microbiology, 5(5), 384.
Quast, C., Pruesse, E., Yilmaz, P., Gerken, J., Schweer, T., Yarza, P., … Glöckner, F. O. (2013). The SILVA ribosomal RNA gene database project: Improved data processing and web-based tools. Nucleic Acids Research, 41(D1), D590-D596.
Radujković, D., Verbruggen, E., Sigurdsson, B. D., Leblans, N. I., Janssens, I. A., Vicca, S., & Weedon, J. T. (2018). Prolonged exposure does not increase soil microbial community compositional response to warming along geothermal gradients. FEMS Microbiology Ecology, 94(2), fix124.
Rinnan, R., Michelsen, A., Bååth, E., & Jonasson, S. (2007). Fifteen years of climate change manipulations alter soil microbial communities in a subarctic heath ecosystem. Global Change Biology, 13(1), 28-39.
Robe, P., Nalin, R., Capellano, C., Vogel, T. M., & Simonet, P. (2003). Extraction of DNA from soil. European Journal of Soil Biology, 39(4), 183-190.
Rochelle, P. A., Cragg, B. A., Fry, J. C., John Parkes, R., & Weightman, A. J. (1994). Effect of sample handling on estimation of bacterial diversity in marine sediments by 16S rRNA gene sequence analysis. FEMS Microbiology Ecology, 15(1-2), 215-225.
Roux, K. H. (2009). Optimization and troubleshooting in PCR. Cold Spring Harbor Protocols, 2009(4), pdb.ip66.
Santamaria, M., Fosso, B., Consiglio, A., De Caro, G., Grillo, G., Licciulli, F., … Pesole, G. (2012). Reference databases for taxonomic assignment in metagenomics. Briefings in Bioinformatics, 13(6), 682-695.
Schlaeppi, K., Bender, S. F., Mascher, F., Russo, G., Patrignani, A., Camenzind, T., … van der Heijden, M. G. A. (2016). High-resolution community profiling of arbuscular mycorrhizal fungi. New Phytologist, 212(3), 780-791.
Schloss, P. D., Westcott, S. L., Ryabin, T., Hall, J. R., Hartmann, M., Hollister, E. B., … Weber, C. F. (2009). Introducing mothur: open-source, platform-independent, community-supported software for describing and comparing microbial communities. Applied and Environmental Microbiology, 75(23), 7537-7541.
Schoch, C. L., Seifert, K. A., Huhndorf, S., Robert, V., Spouge, J. L., Levesque, C. A., … Schindel, D. (2012). Nuclear ribosomal internal transcribed spacer (ITS) region as a universal DNA barcode marker for Fungi. Proceedings of the National Academy of Sciences USA, 109(16), 6241-6246.
Shokralla, S., Spall, J. L., Gibson, J. F., & Hajibabaei, M. (2012). Next-generation sequencing technologies for environmental DNA research. Molecular Ecology, 21(8), 1794-1805.
Sigurdsson, B. D., Leblans, N. I., Dauwe, S., Gudmundsdottir, E., Gundersen, P., Gunnarsdottir, G. E., … Maljanen, M. (2016). Geothermal ecosystems as natural climate change experiments: The ForHot research site in Iceland as a case study. Icelandic Agricultural Sciences, 29, 53-71.
Smith, D. P., & Peay, K. G. (2014). Sequence depth, not PCR replication, improves ecological inference from next generation DNA sequencing. PLoS ONE, 9(2), 090234.
Smith, S. E., & Read, D. J. (2008). Mycorrhizal Symbiosis. Academic Press.
Song, S. J., Amir, A., Metcalf, J. L., Amato, K. R., Xu, Z. Z., Humphrey, G., & Knight, R. (2016). Preservation methods differ in fecal microbiome stability, affecting suitability for field studies. mSystems, 1(3) e00021-16.
Stoeck, T., Bass, D., Nebel, M., Christen, R., Jones, M. D. M., Breiner, H. W., & Richards, T. A. (2010). Multiple marker parallel tag environmental DNA sequencing reveals a highly complex eukaryotic community in marine anoxic water. Molecular Ecology, 19(suppl. 1), 21-31.
Strickland, M. S., Lauber, C., Fierer, N., & Bradford, M. A. (2009). Testing the functional significance of microbial community composition. Ecology, 90(2), 441-451.
Tedersoo, L., Nilsson, R. H., Abarenkov, K., Jairus, T., Sadam, A., Saar, I., … Kõljalg, U. (2010). 454 Pyrosequencing and Sanger sequencing of tropical mycorrhizal fungi provide similar results but reveal substantial methodological biases. New Phytologist, 188(1), 291-301.
Tedersoo, L., Bahram, M., Polme, S., Koljalg, U., Yorou, N. S., Wijesundera, R., … Abarenkov, K. (2014). Global diversity and geography of soil fungi. Science, 346(6213), 1256688.
Tedersoo, L., Bahram, M., Cajthaml, T., Põlme, S., Hiiesalu, I., Anslan, S., … Abarenkov, K. (2015). Tree diversity and species identity effects on soil fungi, protists and animals are context dependent. The ISME Journal, 10, 346-362.
van der Heijden, M. G., Bardgett, R. D., & van Straalen, N. M. (2008). The unseen majority: Soil microbes as drivers of plant diversity and productivity in terrestrial ecosystems. Ecology Letters, 11(3), 269-310.
Weiss, S., Xu, Z. Z., Peddada, S., Amir, A., Bittinger, K., Gonzalez, A., … Hyde, E. R. (2017). Normalization and microbial differential abundance strategies depend upon data characteristics. Microbiome, 5(1), 27.
Wilson, H., Johnson, B. R., Bohannan, B., Pfeifer-Meister, L., Mueller, R., & Bridgham, S. D. (2016). Experimental warming decreases arbuscular mycorrhizal fungal colonization in prairie plants along a Mediterranean climate gradient. PeerJ, 4, e2083.
Winsley, T., van Dorst, J. M., Brown, M. V., & Ferrari, B. C. (2012). Capturing greater 16S rRNA gene sequence diversity within the domain Bacteria. Applied and Environmental Microbiology, 78(16), 5938-5941.
Yang, G., Yang, X., Zhang, W., Wei, Y., Ge, G., Lu, W., … Zhang, Y. (2016). Arbuscular mycorrhizal fungi affect plant community structure under various nutrient conditions and stabilize the community productivity. Oikos, 125(4), 576-585.
Zhang, Y., Dong, S., Gao, Q., Liu, S., Zhou, H., Ganjurjav, H., & Wang, X. (2016). Climate change and human activities altered the diversity and composition of soil microbial community in alpine grasslands of the Qinghai-Tibetan Plateau. Science of the Total Environment, 562, 353-363.
Zogg, G. P., Zak, D. R., Ringelberg, D. B., White, D. C., MacDonald, N. W., & Pregitzer, K. S. (1997). Compositional and functional shifts in microbial communities due to soil warming. Soil Science Society of America Journal, 61(2), 475-481.
Authors: Radujković D1, Verbruggen E1
Reviewer: Vik U2
Affiliations
1 Centre of Excellence PLECO (Plants and Ecosystems), Biology Department, University of Antwerp, Wilrijk, Belgium
2 Section for Genetics and Evolutionary Biology (EVOGENE), Department of Biosciences, University of Oslo, Oslo, Norway