Authors: Speed JDM1, Barrio IC2, Ravolainen VT3
Reviewers: Te Beest M4,5 & Wilfahrt P6
Measurement unit: various (see below); Measurement scale: site to plot (herbivore presence), plot to individual (herbivore damage); Equipment costs: €–€€; Running costs: €; Installation effort: low; Maintenance effort: low; Knowledge need: medium; Measurement mode: manual
Vertebrate herbivory can have dramatic impacts on ecological dynamics at the scale of individual plants, populations, communities, and ecosystem functioning. Herbivore impact on vegetation can be either direct through biomass removal (including grazing, browsing, uprooting, bark stripping) and trampling or indirect through, for example, altered nutrient cycling, vector (e.g. seed) dispersal, disturbance, and changed competitive environments. Herbivory is nearly omnipresent across the world’s ecosystems (Burkepile & Parker, 2017) and its impact on vegetation and ecosystems can outweigh that of climatic change (Post & Pedersen, 2008). However, climate-change studies often fail to quantify herbivory, even though this can be a confounding effect of climatic manipulations.
Assessments of vertebrate herbivory must account for spatial and temporal variation (Austrheim et al., 2011) and may be scale dependent (Senft et al., 1987). Vertebrate herbivores themselves respond directly to environmental change, for example by changing their behaviour, movement patterns, or population dynamics. However, when manipulating environmental change in experiments, treatments may inadvertently affect the activity of vertebrate herbivores, for example, open topped chambers can operate as partial exclosures of vertebrate herbivores (Post & Pedersen, 2008). Assessing vertebrate herbivory is therefore important to avoid confounding effects in climate-change and other environmental manipulation experiments and should be carried out at both site and plot scales. Assessing vertebrate herbivory is also valuable within observational studies. Different species of herbivore can have distinct impacts on ecosystems (e.g. van der Plas et al., 2016); therefore it can be useful to identify vertebrate herbivores to species, or group, where possible.
4.15.1 What and how to measure?
Vertebrate herbivory typically manifests as the removal of plant tissues or organs and can be measured through signs of tissue or organ removal (incidence of shoots or leaves with signs of grazing, browsing, or other types of herbivory) or estimates of biomass removal. However, because vertebrate herbivory is often difficult to detect due to complete removal of individuals, it is often recorded using signs of herbivore presence or activity (e.g. faecal densities, trampling, or disturbance signs). The presence or activity of herbivores should be assessed at a site level, while plant tissue removal is most commonly measured at a plant level, or in small sampling plots.
Herbivore presence or activity
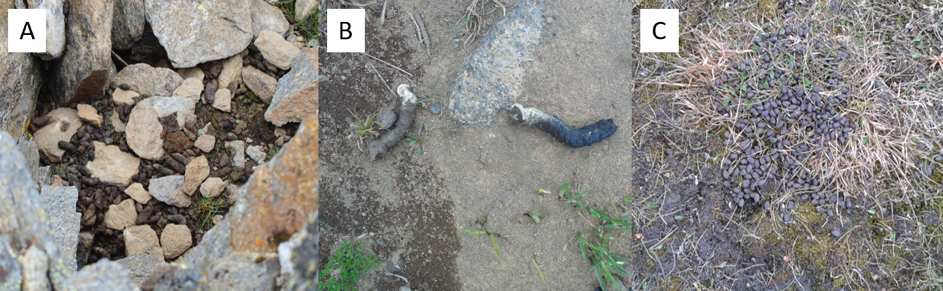
The presence, density, and species composition of vertebrate herbivores is most commonly estimated through indirect assessments of faecal (dung) densities (Figure 4.15.1). These often correlate well with herbivore densities and herbivore species can be identified from the dung (Putman, 1984): many region-specific field guides to identifying animals from tracks and signs exist. Comparisons across sites with different herbivore assemblages are challenging because the identity and relative abundance of different herbivore species can lead to distinct impacts on vegetation. However, indices of “herbivore pressure” can be approximated based on metabolic requirements of each species, as a way to make comparisons at broader spatial scales (Austrheim et al., 2011). For large herbivore species, regional density data may be available (e.g. livestock or hunting statistics) for the study sites, but given the spatial and temporal scale hierarchies of herbivory (Senft et al., 1987) these are often of incorrect spatial or temporal resolution (Bernes et al., 2015).
Faecal densities, typically estimated as densities of pellet groups, can be estimated along line transects (e.g. Cromsigt et al., 2009) or by area (e.g. quadrat) approaches (e.g. Ims et al., 2007). Observer bias (Jenkins & Manly, 2008) and detection probabilities (Marques et al., 2001) should ideally be accounted for. Care should be taken that the spatial scale is appropriate given the ecology of the plant–herbivore interactions in consideration, relative to the size of the environmental-manipulation study plots. For example, some herbivores are likely to have an impact at a scale larger than the experimental plots, such as wide-ranging animals. In these cases, recording herbivore presence at the site level is desirable, because herbivory might be spatially variable and thus more difficult to detect in smaller plots. If the interest of the study is in assessing temporal (e.g. inter-annual) variation in herbivore densities in a certain area, permanent plots or transects can be marked, where faecal pellets are removed during each visit.
Care should be taken in the interpretation of faecal densities at smaller spatial scales since dung and feeding localities become decoupled within daily ranges (with higher faecal densities at, for example, rest sites). Dung densities estimate defecation rates, not necessarily herbivory rates since defecation may vary with season, diet, etc. Furthermore, there is a need to account for dung decay that varies with dietary and environmental factors (Marques et al., 2001): this may be achieved using measurements of dung decomposition under field conditions (e.g. Sitters et al., 2014) or repeated visitation of the same pellet groups (Tsaparis et al., 2009). Dung detection can also vary across different sized species, with a lower chance of detecting pellets of smaller species, or across different habitat types, with a lower chance of detecting dung in denser (ground) vegetation.
A number of other approaches can be used to estimate herbivore presence and densities. These include direct detection of herbivores using camera traps (Brodie et al., 2012) including adaptations for rodent herbivores and subnivean activity (Soininen et al., 2015). Camera traps are more effective to monitor visitation than pellet counts, particularly for species with smaller pellet sizes and closely related species, such as co-occurring deer species (Pfeffer et al., 2018). In addition to these, indirect signs of herbivore presence or activity can be used to record herbivore activity. These include track plots (Lyra-Jorge et al., 2008) or trampling indicators that detect passage of animals, or the presence of rodent runways, winter nests, or latrines (Sutherland, 2006). Indirect indicators can, in the same way as dung surveys, be quantified along transects or using area approaches. More labour-intensive and direct methods such as live-trapping or direct observations can also be applied where conditions allow, taking care to standardise effort between treatments. For live-trapping, this involves standardising the number of traps, bait amount (if used), and duration of trapping period. For direct observation this involves standardising duration of observation, with ideally the same observer between sites. In all cases, these parameters should be reported in the methods.
In some cases, signs of herbivore presence are not easily assigned to a certain herbivore species, or they may only give an indication of relative abundance, for example when quantifying indirect signs of herbivore presence: nevertheless, this information is valuable to approximate “herbivore pressure” at each site and may provide at least some qualitative information for comparisons across sites.
Plant damage
While herbivore presence indicates the potential for impacts of vertebrate herbivores on vegetation and ecosystems, direct measurements of herbivory are more valuable in assessing how herbivores have affected individual plants. Since herbivory involves the removal of plant tissues, this requires assessment of plant parts that are no longer present. This tends to be simpler in practice for woody plant species than for herbaceous plant species. Exclusion of herbivores is one of the most direct ways of assessing the amount of biomass removed by the animals. Often, using size-selective exclosures is the only possible option to separate between different size classes of herbivores (Kartzinel et al., 2014).
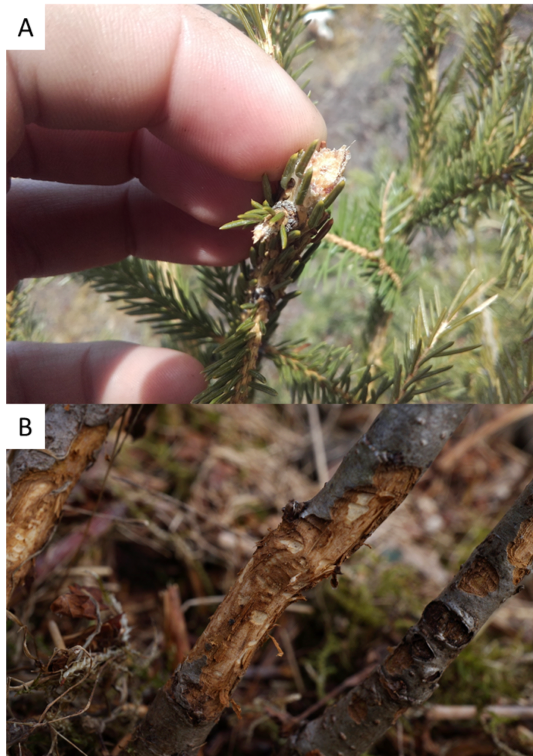
For woody plant species, browsed shoots can be observed in the field (Figure 4.15.2). Browsing pressure is generally assessed as the proportion of shoots that have been browsed. Depending on the shoot structure of the plant species all shoots can be assessed, or in the case of many shoots (e.g. over 100), a subsample, for example every third shoot (Bilyeu et al., 2007). It is possible, in some cases, to distinguish herbivore species (or functional groups) on the basis of the browsing marks since these relate to herbivore dental morphology. The location of browsing signs relative to height and shoot diameter can also be used to partition browsing between herbivore species, although factors such as snow depth also need to be taken into account. Damage to plant parts also depends on plant defensive strategies (see protocol 4.16 Functional traits). Two main factors determining plant structural defence include leaf dimensions and spinescence (see Pérez-Harguindeguy et al., 2013). A recently developed bite size index measures both dimensions simultaneously by using human bites as a proxy to simulate the bite size of a medium-sized mammalian herbivore (Charles-Dominique et al., 2015).
Grazing on herbaceous vegetation can also be assessed as the proportion of shoots grazed or by quantifying grassland heterogeneity as a proportion of short grass (e.g. Cromsigt & Te Beest, 2014). Here, however, it is rarely possible to distinguish herbivore species from grazing marks. These methods are less robust due to the potential for whole organs to be removed and the difficulties in observing grazing signs. As such, herbivore exclusion is the recommended approach for assessing herbivore impacts on herbaceous vegetation, although this would require additional experimental plots.
Timing is crucial for assessing tissue removal by herbivores since browsing and grazing marks become less visible as time since the event increases. Grazing signs are particularly transient. Repeated assessments are therefore recommended, with a minimum frequency of annually for browsing and monthly for grazing.
Camera trap installation
Most approaches for quantifying herbivore densities or herbivory require no prior installation of equipment other than permanent marking of plots or transects if repeated visits are planned, or installation of fences, exclusion cages, or track plots. An exception is the use of automatic trail cameras, also known as wildlife cameras or camera traps, to assess the presence and species of herbivores (Figure 4.15.3). The use of camera traps in ecological monitoring has greatly increased in recent decades (Ahumada et al., 2011; Meek et al., 2014) and cameras are now widely available from a number of manufacturers and for a range of budgets. Placement and installation will depend on the specific research questions. Most studies stress the importance of adequate sampling effort for adequate community-level inferences (Hamel et al., 2013; Cusack et al., 2015). Cameras are usually installed by attaching them to nearby trees or posts, but the height and orientation of the camera (horizontal or perpendicular to the ground) should be considered as they will maximise detection of species of different body size (Tobler et al., 2008; Glen et al., 2013). Most models allow the user to set detection levels, number of photos in a burst, or video recording, and some units can use mobile telephone networks to send images. Maintenance will depend on the battery life and image storage capacity of the unit deployed, but this is becoming less of an issue nowadays. The occurrence of false positive (camera triggered but not by target) and false negative images (camera not triggered by herbivore) needs to be considered (see e.g. Newey et al., 2015 for further details). Motion-triggered settings are more affected by weather, as extremes in temperature or motion caused by wind will increase false positives. The use of time-lapse rather than motion-triggered cameras can overcome the problem of false negatives (Hamel et al., 2013), and the use of time-lapse at short intervals has been recommended to optimise detection rates. Images require careful visual assessment to identify herbivores within images (to species level and to separate from other animals in the image). Detection rates can be interpreted as a proxy of the intensity of herbivore pressure over a given area or time.
 |
 |
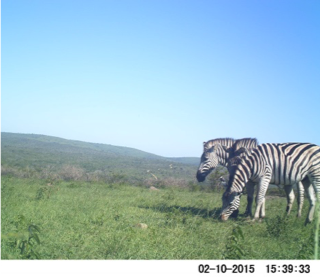 |
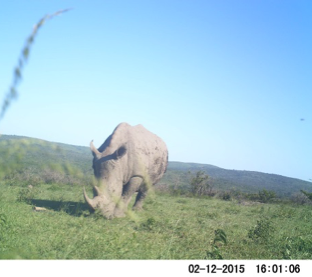
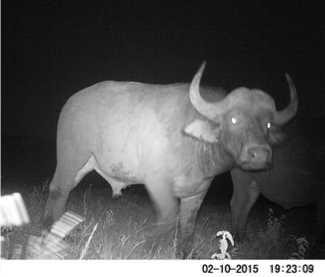
| Figure 4.15.3 Images from camera traps: A) White rhino (Ceratotherium simum), B) African buffalo (Syncerus caffer), and C) zebra (Equus quagga), which can be used to monitor herbivore presence, densities, and/or activity. Photos: Joris PGM Cromsigt and Elizabeth le Roux. | ||
Where to start
Faecal counts: Marques et al. (2001), Putman (1984); camera trapping: Meek et al. (2014); plant damage: Bilyeu et al. (2007)
4.15.2 Special cases, emerging issues, and challenges
Some species of herbivore show specific activities or behaviours that will have unique impacts on vegetation, for example digging by burrowing species (Huntly & Reichman, 1994), grubbing and uprooting by wildfowl (Speed et al., 2009) or suidae (Bueno et al., 2009), and bark stripping by some ungulates (Gill, 1992). Quantifying these types of activities, most commonly through transect or area approaches as outlined for other herbivory signs above, can give additional information on herbivore use of an area. Metabarcoding and other environmental DNA techniques are becoming more common approaches for the identification of plant species eaten by herbivores based on faecal samples or the identification of herbivore species themselves through DNA retained on bite marks (Nichols et al., 2015).
4.15.3 References
Theory, significance, and large datasets
Burkepile & Parker (2017), Post & Pedersen (2008), Senft et al. (1987)
More on methods and existing protocols
Bilyeu et al. (2007), Glen et al. (2013), Pfeffer et al. (2018)
ITEX herbivory protocol (tundra habitat specific)
All references
Ahumada, J. A., Silva, C. E., Gajapersad, K., Hallam, C., Hurtado, J., Martin, E., … Rovero, F. (2011). Community structure and diversity of tropical forest mammals: data from a global camera trap network. Philosophical Transactions of the Royal Society B: Biological Sciences, 366(1578), 2703-2711.
Austrheim, G., Solberg, E. J., & Mysterud, A. (2011). Spatio-temporal distribution of large herbivores in Norway from 1949 to 1999: has decreased grazing by domestic herbivores been countered by increased browsing by cervids? Wildlife Biology, 17, 1-13.
Bernes, C., Bråthen, K. A., Forbes, B. C., Speed, J. D. M., & Moen, J. (2015). What are the impacts of reindeer/caribou (Rangifer tarandus L.) on arctic and alpine vegetation? Environmental Evidence, 4(1), 4.
Bilyeu, D. M., Cooper, D. J., & Hobbs, N. T. (2007). Assessing impacts of large herbivores on shrubs: tests of scaling factors for utilization rates from shoot‐level measurements. Journal of Applied Ecology, 44(1), 168-175.
Brodie, J., Post, E., Watson, F., & Berger, J. (2012). Climate change intensification of herbivore impacts on tree recruitment. Proceedings of the Royal Society B: Biological Sciences, 279(1732), 1366-1370.
Bueno, C., Alados, C., Gómez‐García, D., Barrio, I. C., & García‐González, R. (2009). Understanding the main factors in the extent and distribution of wild boar rooting on alpine grasslands. Journal of Zoology, 279(2), 195-202.
Burkepile, D. E., & Parker, J. D. (2017). Recent advances in plant-herbivore interactions. F1000Research, 6, 119.
Charles-Dominique, T., Midgley, G., & Bond, W. (2015). An index for assessing effectiveness of plant structural defences against mammal browsing. Plant Ecology, 216(10), 1433-1440.
Cromsigt, J. P., & Te Beest, M. (2014). Restoration of a megaherbivore: landscape‐level impacts of white rhinoceros in Kruger National Park, South Africa. Journal of Ecology, 102(3), 566-575.
Cromsigt, J. P., van Rensburg, S. J., Etienne, R. S. & Olff, H. (2009). Monitoring large herbivore diversity at different scales: comparing direct and indirect methods. Biodiversity and Conservation, 18(5), 1219-1231.
Cusack, J. J., Dickman, A. J., Rowcliffe, J. M., Carbone, C., Macdonald, D. W., & Coulson, T. (2015). Random versus game trail-based camera trap placement strategy for monitoring terrestrial mammal communities. PLoS One, 10(5), e0126373.
Gill, R. (1992). A review of damage by mammals in north temperate forests: 1. Deer. Forestry, 65(2), 145-169.
Glen, A. S., Cockburn, S., Nichols, M., Ekanayake, J., & Warburton, B. (2013). Optimising camera traps for monitoring small mammals. PLoS One, 8(6), e67940.
Hamel, S., Killengreen, S. T., Henden, J. A., Eide, N. E., Roed‐Eriksen, L., Ims, R. A., & Yoccoz, N. G. (2013). Towards good practice guidance in using camera‐traps in ecology: influence of sampling design on validity of ecological inferences. Methods in Ecology and Evolution, 4(2), 105-113.
Huntly, N., & Reichman, O. (1994). Effects of subterranean mammalian herbivores on vegetation. Journal of Mammalogy, 75(4), 852-859.
Ims, R. A., Yoccoz, N. G., Brathen, K. A., Fauchald, P., Tveraa, T., & Hausner, V. (2007). Can reindeer overabundance cause a trophic cascade? Ecosystems, 10, 607-622.
Jenkins, K. J., & Manly, B. F. J. (2008). A double-observer method for reducing bias in faecal pellet surveys of forest ungulates. Journal of Applied Ecology, 45(5), 1339-1348.
Kartzinel, T. R., Goheen, J. R., Charles, G. K., DeFranco, E., Maclean, J. E., Otieno, T. O., … Pringle, R. M. (2014). Plant and small‐mammal responses to large‐herbivore exclusion in an African savanna: five years of the UHURU experiment. Ecology, 95(3), 787-787.
Lyra-Jorge, M. C., Ciocheti, G., Pivello, V. R., & Meirelles, S. T. (2008). Comparing methods for sampling large- and medium-sized mammals: camera traps and track plots. European Journal of Wildlife Research, 54(4), 739.
Marques, F. F., Buckland, S. T., Goffin, D., Dixon, C. E., Borchers, D. L., Mayle, B. A., & Peace, A. J. (2001). Estimating deer abundance from line transect surveys of dung: sika deer in southern Scotland. Journal of Applied Ecology, 38(2), 349-363.
Meek, P., Ballard, G., Claridge, A., Kays, R., Moseby, K., O’Brien, T., … Tobler, M. (2014). Recommended guiding principles for reporting on camera trapping research. Biodiversity and Conservation, 23(9), 2321-2343.
Newey, S., Davidson, P., Nazir, S., Fairhurst, G., Verdicchio, F., Irvine, R. J., & van der Wal, R. (2015). Limitations of recreational camera traps for wildlife management and conservation research: A practitioner’s perspective. Ambio, 44(4), 624-635.
Nichols, R. V., Cromsigt, J. P., & Spong, G. (2015). Using eDNA to experimentally test ungulate browsing preferences. SpringerPlus, 4(1), 489.
Pérez-Harguindeguy, N., Diaz, S., Garnier, E., Lavorel, S., Poorter, H., Jaureguiberry, P., … Cornelisson, J. H. C. (2013). New handbook for standardised measurement of plant functional traits worldwide. Australian Journal of Botany, 61(3), 167-234.
Pfeffer, S. E., Spitzer, R., Allen, A. M., Hofmeester, T. R., Ericsson, G., Widemo, F., … Cromsigt, J. P. (2018). Pictures or pellets? Comparing camera trapping and dung counts as methods for estimating population densities of ungulates. Remote Sensing in Ecology and Conservation, 4(2), 173-183.
Post, E., & Pedersen, C. (2008). Opposing plant community responses to warming with and without herbivores. Proceedings of the National Academy of Sciences USA, 105(34), 12353-12358.
Putman, R. J. (1984). Facts from faeces. Mammal Review, 14(2), 79-97.
Senft, R. L., Coughenour, M. B., Bailey, D. W., Rittenhouse, L. R., Sala, O. E., & Swift, D. M. (1987). Large herbivore foraging and ecological hierarchies. Bioscience, 37(11), 789-799.
Sitters, J., Maechler, M. J., Edwards, P. J., Suter, W., & Olde Venterink, H. (2014). Interactions between C:N:P stoichiometry and soil macrofauna control dung decomposition of savanna herbivores. Functional Ecology, 28(3), 776-786.
Soininen, E. M., Jensvoll, I., Killengreen, S. T., & Ims, R. A. (2015). Under the snow: a new camera trap opens the white box of subnivean ecology. Remote Sensing in Ecology and Conservation, 1(1), 29-38.
Speed, J. D. M., Woodin, S. J., Tømmervik, H., Tamstorf, M. P., & van der Wal, R. (2009). Predicting habitat utilization and extent of ecosystem disturbance by an increasing herbivore population. Ecosystems, 12(3), 349-359.
Sutherland, W. J. (2006). Ecological Census Techniques: A Handbook. Cambridge: Cambridge University Press.
Tobler, M., Carrillo‐Percastegui, S., Leite Pitman, R., Mares, R., & Powell, G. (2008). An evaluation of camera traps for inventorying large‐and medium‐sized terrestrial rainforest mammals. Animal Conservation, 11(3), 169-178.
Tsaparis, D., Katsanevakis, S., Ntolka, E., & Legakis, A. (2009). Estimating dung decay rates of roe deer (Capreolus capreolus) in different habitat types of a Mediterranean ecosystem: an information theory approach. European Journal of Wildlife Research, 55(2), 167-172.
Van der Plas, F., Howison, R. A., Mpanza, N., Cromsigt, J. P., & Olff, H. (2016). Different‐sized grazers have distinctive effects on plant functional composition of an African savannah. Journal of Ecology, 104(3), 864-875.
Authors: Speed JDM1, Barrio IC2, Ravolainen VT3
Reviewers: Te Beest M4,5 & Wilfahrt P6
Affiliations
1 Department of Natural History, NTNU University Museum, Norwegian University of Science and Technology, Trondheim, Norway
2 Department of Natural Resources and Environmental Sciences, Agricultural University of Iceland, Reykjavík, Iceland
3 Norwegian Polar Institute, Fram Centre, Tromsø, Norway
4 Environmental Sciences, Copernicus Institute of Sustainable Development, Utrecht University, Utrecht, the Netherlands
5 Centre for African Conservation Ecology, Nelson Mandela University, Port Elizabeth, South Africa
6 Department of Disturbance Ecology, BayCEER, University of Bayreuth, Bayreuth, Germany