Authors: Jaroszynska F1, Eycott AE2,3, Vandvik V1, Halbritter AH1
Reviewers: Peñuelas J4,5, Reinsch S6, Wilfahrt PA7, Wohlgemuth T8
Measurement unit: percentage cover, counts, presence/absence; Measurement scale: plot; Equipment costs: €; Running costs: -; Installation effort: low to medium; Maintenance effort: -; Knowledge need: high (species identification); Measurement mode: manual
Plant community composition is the description of the vegetation in a fixed area by the species present and, often, their abundance. Plant community composition is commonly recorded in vegetation science and is frequently assessed in climate-manipulation studies (Elmendorf et al., 2015; Kröel-Dulay et al., 2015) as well as in other global-change studies (Borer et al., 2014) and along climate and other environmental gradients (e.g. Stevens et al., 2004). Measurements of vegetation composition indicate the plant species’ responses to experimental treatments and environmental gradients in space and time, for example by changes in extinction, colonisation, and/or abundance. Plant communities can respond relatively rapidly (over a timeframe of a few years) and reasonably consistently to a range of different types of climate-manipulation experiments (Elmendorf et al., 2015). Differences between plots, treatments, and sites can be quantified by standardising compositional measurements. Plant community composition provides information on plant−plant interactions (competition, facilitation, etc.), trophic interactions such as herbivory, and more general aspects of ecosystem function (e.g. seasonality, carbon dynamics, or disturbance intensity). Combining compositional data with species functional traits is a powerful tool for inferring more mechanistic changes to communities and their function (see protocol 4.16 Functional traits; Díaz et al., 2004; Garnier et al., 2007; Enquist et al., 2015).
4.8.1 What and how to measure?
There are three main methods of estimating species composition in climate-change studies: i) visual estimation of the proportion of the sample area covered by each species, either as percent or cover classes, ii) the point-intercept method, and iii) direct estimation of the number of individuals of each species. The choice of method depends on the ecosystem and the scientific question. For example, to estimate species’ percentage cover or to apply the point-intercept method, a clear view from directly above the vegetation is needed. In all cases, plots should be permanently marked at the corners or given precise GPS coordinates for revisitation purposes (for information on plot selection and marking, see protocol 2.1.1 Aboveground plant biomass). The plot should be located in representative vegetation, by which we mean that areas with unusually tall, short, species-rich, or species-poor vegetation in relation to the surroundings should be avoided.
We suggest the following for selecting which method is best.
- i) Visual estimation of species’ percentage cover is preferred if:
-
-
- Rare species are part of the ecosystem or of interest to the research
- The vegetation is in the form of a dense mat, such as is common among bryophytes or lichens or cushion plants, which are better estimated by their cover and height
- Taxonomic expertise is high.
-
- ii) The point-intercept method is best if
-
-
- Both species composition and a proxy for biomass are needed (see also protocol 2.1.1 Aboveground plant biomass, non-forest system)
- Vegetation has a highly layered canopy, where the leaf area index (LAI) is greater than one
- The 3D space occupancy of plant species is of interest
- Dominant plant species are the main interest, with low importance of rare species
- The surveying team is large and/or inexperienced, as this method is more objective than visual estimation
- Time is not limiting.
-
iii) Direct estimation of number of individuals per species is best if:
-
-
- You work in forests or shrubland where the distinction of individuals is clear. However, understorey vegetation is still better recorded as percent cover or with the point-intercept method. Moreover, woody species cover should also be estimated at multiple strata (e.g. herb, shrub, canopy layer; see Peet et al., 1998)
- Vegetation is sparse enough such that individual ramets or genets are distinguishable
- Depending on the research questions, woody individuals are sometimes counted only above a threshold diameter at breast height (DBH, e.g. 10 cm or 12 cm) or counted in size classes.
-
Plot size. As a minimum, this should be the smallest area which makes it possible to recognise the ecosystem or habitat type. Even though rules have been developed over several decades for minimal areas of vegetation types in the context of phytosociology (e.g. Mueller-Dombois & Ellenberg, 1974), no set rules have emerged for wider use. A reasonable plot size depends on the organism size, the research question, and the focal response variables, and can range from a few square centimetres to hectares. Here is a list of things to consider:
-
-
- Larger individual constituent plants (e.g. trees) require larger plots, whereas small or fine-scaled organisms (e.g. bryophytes or grasses) require smaller plots. At the very least, a plot should contain several individuals.
- Plots should neither be so small as to miss frequent species altogether, nor so large that it becomes easy to overlook occasional or rare species. This implies differently-sized plots for different organisms and habitats, ranging from tens-of-centimetre scales for small-statured organisms and fine-scaled habitats (bryophytes, small vascular plants, low-productive grasslands, tundra, mire structures) via approximately metre-scaled plots (more productive grasslands, heathlands, forest understorey) to tens of metres (trees, forest).
- Plot size should not exceed treatment area and there should ideally be a buffer zone (an area around the edge which is treated but not recorded).
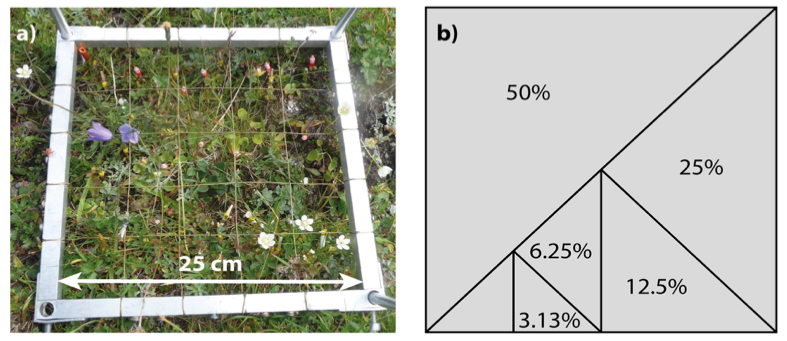
- If the plot size is large compared to the constituent individuals, it may be helpful to record community data in subplots (Figure 4.8.1) by dividing the whole plot up and either recording all subplots or by taking a randomly assigned subset. Subplot analyses can also be useful if there are likely (and potentially interesting) edge effects in the experiment, or if particular species groups or life-history stages differ considerably in size and spatial structure – in this case not all life-stages are recorded at all sampling scales (see Vandvik, 2004). Patterns can be captured more consistently by averaging over several subplots, i.e. using smaller subplots spread over the area, than by using a single large subplot of equivalent total area (Green, 1979).
-
Co-variables. The research question and habitat type will determine the taxonomic sub-group(s) of interest (e.g. vascular plants, cryptograms) and these should be separated to the species level. However, at a minimum, all other sub-groups should be measured at an aggregated level along with additional variables explaining the plot structure. Such variables may include the cover (or pin-point hits) of various forms of substrate (e.g. rocks, bare soil), litter, or animal faeces. Grazing or other disturbance of the plot (e.g. trampling, rodent nesting) should also be noted.
The height of the vegetation should be measured, becaused it can be used to estimate biomass (see protocol 2.1.1 Aboveground plant biomass). It can be difficult to measure the ‘average’ vegetation height, so there are some options depending on your vegetation type (see Stewart et al., 2001). In direct measurement, there needs to be a predetermined method for deciding what height you are trying to measure – the very tallest, the highest leaf, or the height of a fixed percentage of the biomass. We reccomend ignoring extruding flowering stems, instead taking the highest leaf, and measure several subpoints per plot. Otherwise employ a ‘floating disc’ – a circular plastic disc with a small circular hole in the centre. A cylindrical stick marked up with centimets (or millimetres depending on the vegetation height) is placed in the middle of the plot and the disc slipped over the top and dropped down. The disc should be heavy enough to press down extruding strands of grass but not enough to leave a permanent mark in the vegetation. The floating disc method works best in taller vegetation (Stewart et al., 2001).
For studies where finer-scale patterns or species dynamics are of interest, life stages of plant species can be recorded. For example, seedling count or reproductive status give information about recruitment and reproduction, although these are more thoroughly covered in the plant population dynamics section (see protocol 4.3 Plant demography).
Timing. All methods should be carried out during the peak growing season to derive a complete understanding about which species dominate the growth and which species play a role in peak growing season interactions. The plant community assessment can be aligned with estimation of aboveground biomass (see protocol 2.1.1 Aboveground plant biomass). Depending on both the study question and the vegetation type, two assessments per year may be needed to cover the whole species diversity, for example one in spring and one in early summer in deciduous woodland with many spring geophytes, or in surveys where demography such as life-history stages are recorded (e.g. seedlings, sterile, fertile individuals, see protocol 4.3 Plant demography). Additional assessments can be conducted earlier and later than peak growing season if within-year dynamics are of interest. For instance, in mixed prairies of the US, peak growing season differs for the co-dominant C3 and C4 plant residents, meaning single sampling dates may bias compositional estimates (Ode et al., 1980).
Visual estimation of species cover
Visual estimation of cover, for example percent cover, is most commonly used in mesic and productive grassland systems, for small plots at ground layer in forests, and in dwarf-shrub systems. Percent cover captures whole-plot species composition, thus making this technique suitable for studies where the presence of rare species is of interest.
The percent cover of each vascular plant species is estimated visually, usually at peak growing season. All species whose canopy intersects with permanently marked plots should be captured both as species presence and species’ occupied space. Percent cover is the vertical projection of each species onto an imagined two-dimensional plane that is parallel to the ground, taking into account all aboveground plant parts. Thus, the total plot cover can reach more than 100%, allowing for overlapping plants within the canopy, and the cover can include both species rooted inside and outside the plot boundary. In addition, we advise that you estimate the percent cover of surface substrate types (bare soil and/or bare rock) and litter: record only the substrate which is visible when looking directly through the vegetation from above.
Estimation in categories may save time relative to pseudo-exact cover-estimates, and for decades, categorical scales such as decimal (Londo, 1975) and coarser estimates (e.g. DAFOR or DOMIN scales, Braun-Blanquet, 1964) have been used. Presence measures over several subplots is another useful compromise if it is not possible to perform percent cover calibration between several observers but rare species are of interest (and therefore point-quadrat is not appropriate). However, we recommend that percent cover is estimated directly, at as fine a resolution as possible, because continuous data have better analytical properties and it increases the potential to be used in cross-study analyses − it is easier to convert from a more detailed scale to a less detailed one than the other way round. Direct estimation of percent cover has the advantage that it allows translation to continuous numeric values for further analysis, even though the error around estimates can be high (particularly in mid-range values, 25−75%). A conversion table for Londo and other common abundance-class measurements to fixed percent cover points is found in Annex 1 of the ICP Forests vegetation sampling protocol (Canullo et al., 2016): note that scale data should still be analysed as non-continuous data even after conversion to percentages. While it is difficult to estimate cover precisely, we present techniques in the next paragraph to guide estimations and increase data quality.
Several techniques are available for reducing error rates in direct percent cover estimation. Practice and cross-referencing with an external reference and across field workers is key. Printed shapes of known area can be used as guides to visual area estimation (Figure 4.8.1b). Some studies maintain a full integer percentage scale but use 0.1 or “present” for items below 1% cover (Vandvik et al., submitted). Subplots can be used to guide the estimation, for example, in a quadrat with a 5 x 5 grid of subplots, each subplot will represent 4% area (Figure 4.8.1a). Subplots can also be useful for collecting additional data such as fine-scale spatial distribution, species co-occurrence at the fine scale, and various kinds of frequency data, and they may be useful for downstream data checking and corrections. For example, a species occurring in only one subplot cannot have greater cover than the percent of the plot occupied by one subplot. There are examples of what different amounts of cover look like at https://cnps.org/wp-content/uploads/2018/03/percent_cover_diag-cnps.pdf and a worked example of percent cover calculated from a photograph in Chen et al. (2010).
 |
|
Figure 4.8.1: Species presence, abundance, fertility etc. can be measured both at the whole-plot and sub-plot scales, and printed cards with shapes of different area can be used to aid visual estimation at the plot scale. a) Quadrat (25 x 25 cm) used for visual cover estimation with 5 x 5 subplots, each subplot will represent 4% of the total plot area. b) Printed field card with different areas representing 50, 25, 12.5, 6.25, and 3.13% of the total area. Photo: Siri Lie Olsen. |
Control plots are very important for data quality control in plant compositional measurements. The species turnover might vary between treatments but is not expected to be large between years for control plots and is therefore a source of information about overlooked or misidentified species. Finally, if species are hard to identify when only vegetative organs are present, a record of their reproductive status gives an indication of the reliability of the identification, which can then be cross-referenced to a year when that species was observed with reproductive organs.
Point-intercept method
The point-intercept method is primarily used to measure plant cover, but it can indirectly quantify plant frequency and total aboveground biomass (Jonasson, 1988; see protocol 2.1.1 Aboveground plant biomass). It is suited for studies focused on the more common species within a community, where the leaf area index (LAI) is greater than one, or where 3D space occupancy of plant species is of interest. One benefit of the point-intercept method is that it can be used to aggregate the cover of different species – in visual estimation of percent cover, vertical overlap of individuals within a species cannot be accounted for when aggregating data into groups at the analysis stage.
Where accurate estimates of the dominant species within a given community are more relevant to the research question, the point-intercept method can be a less subjective approach than percent cover (Ferris-Kaan & Patterson, 1992; Traxler, 1997; Bonham, 2013). This is because potential observer bias is reduced as quantification is more objective (a plant is touched by the pin or not). Furthermore, all plants touched by the pin must be identified so it may be less likely that inconspicuous individuals are overlooked. As a result, however, the technique often misses rare species, particularly where point frequency is low. The point-intercept method is preferred when the recording team is inexperienced or is large, but experienced botanists may find that this method uses more time compared to the percent cover method, particularly if there are few hard-to-recognise species in their system.
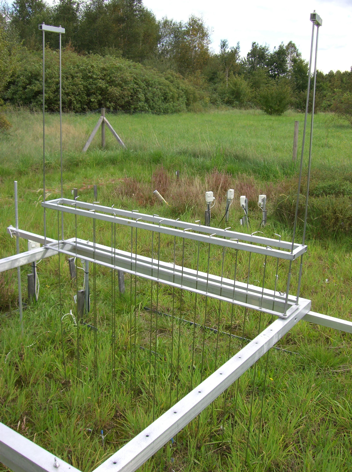
The technique works by lowering a pin vertically into the vegetation at a predetermined point, either on a grid (Pauli et al., 2015) or along a transect (INCREASE, 2014), and the identification of each plant touched by the pin on its route to the ground is noted. The GLORIA project (Pauli et al., 2015) uses a knitting needle (approx. 30 cm) of 2 mm diameter, while longer pins are needed in taller vegetation (see Figure 4.8.2). Multiple hits of the same species are recorded, in addition to its life stage (alive/dead). The point at which the pin is lowered is predetermined to reduce bias and allow for accurate resurveying. Cover is expressed as the total number of hits per species as a proportion of the total number of pin measurements. The number of pins needed for adequate cover estimations is large (Ferris-Kaan & Patterson, 1992; Traxler, 1997; Bonham, 2013): the GLORIA project uses 100 points per 1m2 plot while the INCREASE project uses 300 points distributed along transects up to 4 m (INCREASE, 2014).
 |
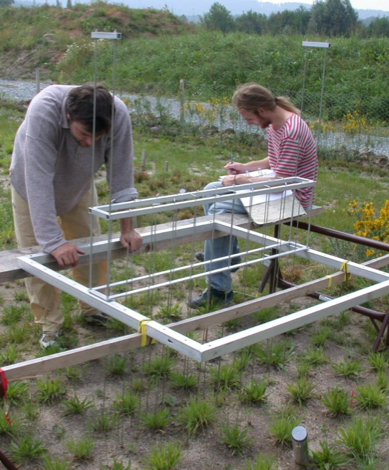 |
Figure 4.8.2: Point intercept method. Photo: Juergen Kreyling, EVENT experiment. |
Direct estimation of number of individuals per species
Recording abundance by number of individuals (i.e. stem density) is most often used in forests where individuals are distinct (although this can be effectively combined with cover estimates of all species at multiple strata, e.g. herb layer, shrub layer, canopy layer; see Peet et al., 1998) or in systems where vegetation is sparse (e.g. deserts, annual plant communities). A nominal scale of species abundance may be more suitable when the number of individuals varies by several orders of magnitude. Occurrence is then classed into 1−10, 10−100, 100−1000, or >1000 individuals present. It is important to understand the life cycle of all of the species in order to decide whether to count ramets (distinct stems) or genets (distinct genetic individuals; see protocol 4.2 Plant demography). Individual count measurements are usually combined with some kind of individual size data.
Indices calculated from raw compositional data
Species compositional data can be used to extract species presence for presence/absence analyses such as species richness (count data), while abundance allows for calculation of a wider variety of indices, such as community weighted trait means (Funk et al., 2017; see next paragraph), beta-diversity (Chao et al., 2005), species diversity (e.g. Shannon index), and evenness (Hill, 1973; Smith & Wilson, 1996). The choice of the most appropriate diversity index is dependent on the question and often a matter of quite some discussion in the ecological community: Magurran (2003) provides detailed guidance on this. Additionally, calculating relative abundances (as opposed to absolute abundance) allows for comparison of dominance patterns in plots that differ in productivity (Heckman et al., 2017).
Plant community compositional data can be combined with continuous numerical trait values to give mean trait values for plots, which are currently a popular way to compare ecological function between treatments and between sites or even different ecosystems. In Europe, species indicator values (a “soft” trait, i.e. not one which is physiologically established and non-plastic) are often applied to compare the environment of plots or subplots (examples of the lists of indicator values include Ellenberg et al., 1991; Landolt et al., 2010; for reviews of the utility of indicator values see Zeleny & Schaffers, 2012; Diekmann, 2003). The trait value for each species is multiplied by the percent cover for that species (or added if presence/absence data are used), then all the totals are added together and divided by the sum of all the percent cover values for the plot to obtain a mean plot value called a community-weighted mean (see protocol 4.16 Functional traits; Funk et al., 2017). Villéger et al. (2008) provide alternative weighted approaches for situations requiring categorical traits.
Where to start
Bonham (2013), Ferris-Kaan & Patterson (1992), Peet et al. (1998).
4.8.2 Special cases, emerging issues, and challenges
Accuracy of taxonomic identification
Plants should be identified to species where possible and taxonomy should follow standard nomenclature. Ensuring that everyone working in the field uses a consistent set of plant names reduces the potential for error during data analysis. The Plant List (TPL; http://www.theplantlist.org/) and the Taxonomic Name Resolution Service (TNRS; Boyle et al. 2013) are working lists of primarily vascular plants, and both are available as a R packages for data analysis: Taxostand (Cayuela et al., 2012) and taxize (Chamberlain & Szöcs, 2013; Chamberlain et al., 2016).
Where time or taxonomic knowledge is limited, or to answer different ecological questions, an estimation of plant functional group cover is taken. In this case, graminoids, non-leguminous forbs, leguminous forbs, bryophytes, shrubs, and trees are common groupings, and group cover can be estimated as described above for herbaceous systems. This information can also be inferred from full species composition.
Observer bias and survey repeatability
It is important to calibrate cover estimates of all recorders to reduce observer bias. It is ideal to have two or more recorders working together per plot, but as a minimum all recorders should calibrate their estimates at the start of the project or field season by separately analysing a set of the same plots and comparing their findings. This should be repeated, using new plots each time, until the estimates of all recorders are within predefined acceptable bounds. Recalibration throughout the field season is advised. Observer calibration is not as critical for the point-intercept method, but all recorders should thoroughly familiarise themselves with the protocol to avoid errors in sampling procedure (e.g. missing points within the point grid). As well as keeping a record of the observer for each plot, external data such as weather should be recorded as it has been shown to affect the quality of surveys (Burg et al., 2015).
Estimating the species pool of an experimental site
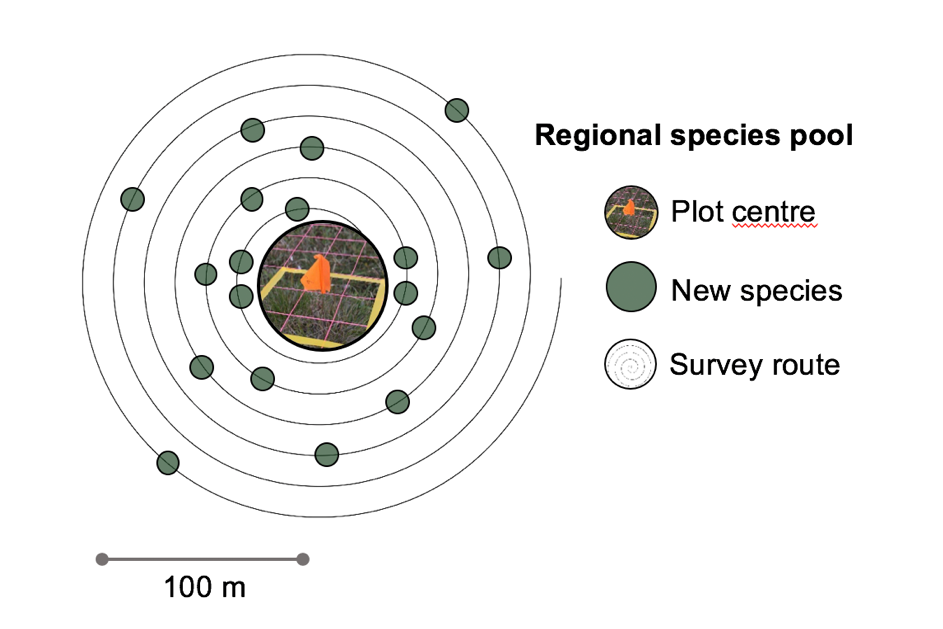
The species pool around a long-term climate change experiment can influence plot level change in species composition over time. It can be useful to know how large the local species pool is to understand the heterogeneity in species diversity across an experimental site and to get estimates of so-called “dark diversity” (absent species; Pärtel et al. 2011). The ITEX species pool protocol outlines methods for quantifying the size and diversity of the species pool around long-term monitoring ecological plots.
All species in an area of 100 – 250 m radius around an experimental site are recorded (Figure 4.8.3). The sampling is started in the centre of the site recording the species all species in a 0.0625, 1 and 5m2 radius. From there, all new species are recorded walking in larger and larger circles around the mid point (roughly 10 m appart). The location for the starting point and all new species are marked with a GPS, to get their distance from the centre. For more details on the method see Species pool protocol for the International Tundra Experiment Network (ITEX) (Rixen et al., 2019).
Species community data analysis
Methods for analysis of vegetation compositional data vary: one of the most popular is ordination. Ordination reduces the complexity of the data to positions on one to several axes. It is a useful way to visualise the data and see which samples are similar in composition, and there are methods to relate this to environmental conditions (Borcard et al., 2018). Choice of ordination method depends on the underlying data structure and analytical aim, although there remain “strongly divergent” opinions on the usefulness of particular methods (Minchin & Oksanen, 2015; see other papers within the same issue for defences of the various methods). Guidance for choosing amongst the parametric forms of ordination can be found in Chapter 5 of Jongman et al. (1995). For analytical packages offering ordination techniques, the vegan package in R (Oksanen et al., 2018) is the most widely used at this time and Canoco is also popular (Šmilauer & Lepš, 2014). In both the visual estimation of percent cover and in the point-intercept method, the distribution of values for individual plants follows a non-normal distribution and should be analysed accordingly (Damgaard, 2009).
4.8.3 References
Theory, significance, and large datasets
Elmendorf et al. (2015) summarise and compare the outcomes of various warming experiments on plant community composition in tundra environments and consider the pros and cons of different methods. Peñuelas et al. (2013) compare and integrate climate-change effects at different levels of biological organisation from the genome to the region, including the community. Franklin et al. (2016) conceptually embed vegetation analysis and small-scale climate-manipulation experimentation within the different common types of environmental-change monitoring and modelling which together form our knowledge base for forecasting future landscapes.
More on methods and existing protocols
Plant cover is described in depth in many of the climate-manipulation experiment protocols. We draw particular attention to the protocols from GLORIA (Pauli et al., 2015, pp. 38-43), SeedClim (Vandvik et al., submitted), and INCREASE (INCREASE, 2014, pp. 6-7) projects. Standardised illustrations of percent cover values are presented in Law et al. (2008, p22). Well-used protocols from distributed experiments other than climate manipulations include NutNet (at https://nutnet.umn.edu/exp_protocol, section a) and the Herbivory Network. There are also a few protocols from large-scale monitoring networks which integrate field and canopy layer monitoring for forests within the same sampling system, of which ICP forests and the UK Environmental Change Network are two examples (Rodwell et al., 1996; UNECE ICP, 2016).
All references
Bonham, C. D. (2013). Measurements for Terrestrial Vegetation. Chichester: John Wiley & Sons.
Borcard, D., Gillet, F., & Legendre, P. (2018). Numerical Ecology with R. Springer International Publishing.
Borer, E. T., Harpole, W. S., Adler, P. B., Lind, E. M., Orrock, J. L., Seabloom, E. W., & Smith, M. D. (2014). Finding generality in ecology: a model for globally distributed experiments. Methods in Ecology and Evolution, 5(1), 65-73.
Boyle, B., Hopkins, N., Lu, Z., Garay, J. A. R., Mozzherin, D., Rees, T., … Lowry, S. (2013). The taxonomic name resolution service: an online tool for automated standardization of plant names. BMC Bioinformatics, 14(1), 16.
Braun-Blanquet, J. (1964). Pflanzensoziologie. Grundzüge der Vegetationskunde. Vienna: Springer.
Burg, S., Rixen, C., Stöckli, V., & Wipf, S. (2015). Observation bias and its causes in botanical surveys on high‐alpine summits. Journal of Vegetation Science, 26(1), 191-200.
Canullo, R., Starlinger, F., Granke, O., Fischer, R., & Aamlid, D, (2016). Part VI.1: Assessment of ground vegetation. In: UNECE ICP Forests Programme Co-ordinating Centre (Ed.), Manual on Methods and Criteria for Harmonized Sampling, Assessment, Monitoring and Analysis of the Effects of Air Pollution on Forests (pp. 1-18). Eberswalde: Thünen Institute of Forest Ecosystems [http://www.icpforests.org/Manual.htm].
Cayuela, L., Granzow‐de la Cerda, Í., Albuquerque, F. S., & Golicher, D. J. (2012). Taxonstand: An R package for species names standardisation in vegetation databases. Methods in Ecology and Evolution, 3(6), 1078-1083.
Chamberlain, S., & Szöcs, E. (2013). taxize – taxonomic search and retrieval in R. F1000Research, 2, 191.
Chamberlain, S., Szöcs, E., Boettiger, C., Ram, K., Bartomeus, I., Baumgartner, J., … O’Donnell, J. (2016). taxize: Taxonomic information from around the web. R package version 0.7.8. https://github.com/ropensci/taxize.
Chao, A., Chazdon, R. L., Colwell, R. K., & Shen, T. J. (2005). A new statistical approach for assessing similarity of species composition with incidence and abundance data. Ecology Letters, 8(2), 148-159.
Chen, Z., Chen, W. E., Leblanc, S. G., Henry, G. H., & Chen, W. (2010). Digital photograph analysis for measuring percent plant cover in the Arctic. Arctic, 63 (3), 315-326.
Damgaard, C. (2009). On the distribution of plant abundance data. Ecological Informatics, 4(2), 76-82.
Díaz, S., Hodgson, J. G., Thompson, K., Cabido, M., Cornelissen, J. H. C., Jalili, A., … Band, S. R. (2004). The plant traits that drive ecosystems: evidence from three continents. Journal of Vegetation Science, 15(3), 295-304.
Diekmann, M. (2003). Species indicator values as an important tool in applied plant ecology – a review. Basic and Applied Ecology, 4(6), 493-506.
Ellenberg, H., Weber, H. E., Düll, R., Wirth, V., Werner, W., & Paulissen, D. (1991). Zeigerwerte von Pflanzen in Mitteleuropa. Scripta Geobotanica, 18, 1-248.
Elmendorf, S. C., Henry, G. H., Hollister, R. D., Fosaa, A. M., Gould, W. A., Hermanutz, L., … Magnusson, B. (2015). Experiment, monitoring, and gradient methods used to infer climate change effects on plant communities yield consistent patterns. Proceedings of the National Academy of Sciences USA, 112(2), 448-452.
Enquist, B. J., Norberg, J., Bonser, S. P., Violle, C., Webb, C. T., Henderson, A., … Savage, V. M. (2015). Scaling from traits to ecosystems: developing a general trait driver theory via integrating trait-based and metabolic scaling theories. Advances in Ecological Research, 52, 249-318.
Ferris-Kaan, R., & Patterson, G. S. (1992). Monitoring Vegetation Changes in Conservation Management of Forests (Forestry Commission Bulletin 108). London: HMSO.
Franklin, J., Serra-Díaz, J. M., Syphard, A. D., & Regan, H. M. (2016). Global change and terrestrial plant community dynamics. Proceedings of the National Academy of Sciences USA, 113(14), 3725-3734.
Funk, J. L., Larson, J. E., Ames, G. M., Butterfield, B. J., Cavender‐Bares, J., Firn, J., … Wright, J. (2017). Revisiting the Holy Grail: using plant functional traits to understand ecological processes. Biological Reviews, 92(2), 1156-1173.
Garnier, E., Lavorel, S., Ansquer, P., Castro, H., Cruz, P., Dolezal, J., … Grigulis, K. (2007). Assessing the effects of land-use change on plant traits, communities and ecosystem functioning in grasslands: a standardized methodology and lessons from an application to 11 European sites. Annals of Botany, 99(5), 967-985.
Green, R. H. (1979). Sampling Design and Statistical Methods for Environmental Biologists. New York: John Wiley & Sons.
Heckman, R. W., Halliday, F. W., Wilfahrt, P. A., & Mitchell, C. E. (2017). Effects of native diversity, soil nutrients, and natural enemies on exotic invasion in experimental plant communities. Ecology, 98(5), 1409-1418.
Hill, M. O. (1973). Diversity and evenness: a unifying notation and its consequences. Ecology, 54(2), 427-432.
INCREASE (2014). An integrated network on climate change activities on shrubland ecosystems: final report. Department of Geosciences and Natural Resource Management, University of Copenhagen. https://cordis.europa.eu/result/rcn/164418_en.html
Jonasson, S. (1988). Evaluation of the point intercept method for the estimation of plant biomass. Oikos 52(1), 101-106.
Jongman, R. H. G., ter Braak, C. J. F., & van Tongeren, O. F. R. (1995). Data Analysis in Community and Landscape Ecology. Cambridge: Cambridge University Press.
Kröel-Dulay, G., Ransijn, J., Schmidt, I. K., Beier, C., De Angelis, P., De Dato, G., … Peñuelas, J. (2015). Increased sensitivity to climate change in disturbed ecosystems. Nature Communications, 6, 6682.
Landolt, E., Bäumler, B., Erhardt, A., Hegg, O., Klötzli, F., Lämmler, W., … Urmi, E. (2010). Flora Indicativa: Ökologische Zeigerwerte und Biologische Kennzeichen zur Flora der Schweiz und der Alpen. Haupt, Bern.
Law, B. E., Akebauer, T., Campbell, J. L., Chen, J., Sun, O., Schwartz, M., … Verma, S. (2008). Terrestrial Carbon Observations: Protocols for vegetation sampling and data submission. Rome: FAO.
Londo, G. (1975). Dezimalskala für die vegetationskundliche Aufnahme von Dauerquadraten. In W. Schmidt (Ed.), Sukzessionsforschung. Bericht über das Internationale Symposia der Internationalen Vereinigung für Vegetationskunde, 1973 (pp. 316-317). Netherlands: Springer.
Magurran, A. E. (2003). Measuring Biological Diversity. Oxford: Wiley-Blackwell.
Minchin, P. R., & Oksanen, J. (2015). Statistical analysis of ecological communities: progress, status, and future directions. Plant Ecology, 216(5), 641-644.
Mueller-Dombois, D., & Ellenberg, H. (1974). Aims and Methods of Vegetation Ecology. New York: Wiley.
Ode, D. J., Tieszen, L. L., & Lerman, J. C. (1980). The seasonal contribution of C3 and C4 plant species to primary production in a mixed prairie. Ecology, 61(6), 1304-1311.
Oksanen, J., Blanchet, F. G., Friendly, M., Kindt, R., Legendre, P., McGlinn, D., … Wagner, H. (2018). Vegan: Community ecology package. R package version 2.5-2. https://CRAN.R-project.org/package=vegan.
Pauli, H., Gottfried, M., Lamprecht, A., Niessner, S., Rumpf, S., Winkler, M., … Grabherr, G. (2015). The GLORIA Field Manual – Standard multi-summit approach, supplementary methods and extra approaches (5th ed.). Vienna: Austrian Academy of Sciences & University of Natural Resources and Life Sciences.
Pärtel, M., Szava-Kovats, R., & Zobel, M. (2011). Dark diversity: shedding light on absent species. Trends in Ecology & Evolution, 26(3), 124-128.
Peet, R. K., Wentworth, T. R., & White, P. S. (1998). A flexible, multipurpose method for recording vegetation composition and structure. Castanea, 63(3), 262-274.
Peñuelas, J., Sardans, J., Estiarte, M., Ogaya, R., Carnicer, J., Coll, M., … Filella, I. (2013). Evidence of current impact of climate change on life: a walk from genes to the biosphere. Global Change Biology, 19(8), 2303-2338.
Rixen, C., Daskalova, G., Bjorkman, A., and Normand, S. (2019). Species Pool Protocol for the International Tundra Experiment Network (ITEX). OSF. June 16. https://osf.io/agdfq/ DOI: 10.17605/OSF.IO/AGDFQ
Rodwell, J. S., Sykes, J. M., & Helps, M. B. (1996). The UK Environmental Change Network Protocols for Standard Measurements at Terrestrial Sites Protocol V: Vegetation. Swindon: UK Natural Environment Research Council.
Šmilauer, P., & Lepš, J. (2014). Multivariate Analysis of Ecological Data Using Canoco 5. Cambridge: Cambridge University Press.
Smith B., & Wilson J. B. (1996). A consumer’s guide to evenness indices. Oikos, 76, 70-82.
Stevens, C. J., Dise, N. B., Mountford, J. O., & Gowing, D. J. (2004). Impact of nitrogen deposition on the species richness of grasslands. Science, 303(5665), 1876-1879.
Stewart, K. E. J., Bourn, N. A. D., & Thomas, J. A. (2001), An evaluation of three quick methods commonly used to assess sward height in ecology. Journal of Applied Ecology, 38(5), 1148-1154.
Traxler, A. (1997). Handbuch des Vegetationsökologischen Monitorings: Methoden, Praxis, angewandte Projekte. Teil A: Methoden. Vienna: Umweltbundesamt.
UNECE ICP Forests Programme Co-ordinating Centre (Ed.) (2016). Manual on methods and criteria for harmonized sampling, assessment, monitoring and analysis of the effects of air pollution on forests. Eberswalde: Thünen Institute of Forest Ecosystems. http://icp-forests.net/page/icp-forests-manual
Vandvik, V. (2004). Gap dynamics in perennial subalpine grasslands: trends and processes change during secondary succession. Journal of Ecology, 92, 86-96.
Vandvik, V., Klanderud K., Skarpaas O., Telford R. J., Halbritter A. H., & Goldberg, D. E. (submitted to Ecology Letters). Context-dependencies in biodiversity response to climate change are reduced by expressing abiotic environments in biological terms.
Villéger, S., Mason, N. W., & Mouillot, D. (2008). New multidimensional functional diversity indices for a multifaceted framework in functional ecology. Ecology, 89(8), 2290-2301.
Zelený, D., & Schaffers, A. P. (2012). Too good to be true: pitfalls of using mean Ellenberg indicator values in vegetation analyses. Journal of Vegetation Science, 23(3), 419-431.
Authors: Jaroszynska F1, Eycott AE2,3, Vandvik V1, Halbritter AH1
Reviewers: Peñuelas J4,5, Reinsch S6, Wilfahrt PA7, Wohlgemuth T8
Affiliations:
1 Department of Biological Sciences and Bjerknes Centre for Climate Research, University of Bergen, Bergen, Norway
2 Department of Biological Sciences, University of Bergen, Bergen, Norway
3 Faculty of Biosciences and Aquaculture, Nord University, Steinkjer, Norway
4 CSIC, Global Ecology Unit CREAF-CSIC-UAB, Bellaterra, Spain
5 CREAF, Cerdanyola del Vallès, Spain
6 Centre for Ecology and Hydrology, Environment Centre Wales, Bangor, UK
7 Department of Disturbance Ecology, BayCEER, University of Bayreuth, Bayreuth, Germany
8 Forest Dynamics, Swiss Federal Institute for Forest, Snow and Landscape Research WSL, Birmensdorf, Switzerland