Authors: Hegland SJ1, Gillespie MAK1
Reviewer: Sydenham MAK2
Measurement unit: number of pollinators per flower per time unit/various network descriptors; Measurement scale: site, plot, plant or flower; Equipment costs: €€€; Running costs: € Installation effort: low; Maintenance effort: low; Knowledge need: medium; Measurement mode: manual
Data on pollinator visitations are usually collected via observations of interactions between animal pollinators and flowers and can be recorded at one or several sites. Such pollinator visitation observations can be used across a wide range of climate- and global-change studies. The data are relevant both when performing experiments on plant or insects and when observing fine- to coarse-scale impacts of various factors. The data are specifically used to i) calculate the pollinator visitation rate, ii) describe the structure of individual plant–pollinator interaction networks (see Protocol 4.12 Pollinator composition), and iii) describe the structural differences between networks if several study sites are surveyed.
The pollinator visitation rate (also called “flower visitation rate”, e.g. the number of pollinators visiting a flower per unit time) is the most commonly used variable to assess animal pollination and its contribution to plant reproduction (Garibaldi et al., 2013). Animal pollination is the most common pathway of sexual reproduction in plants and is considered a key regulating ecosystem service due to the mutual benefits for plants and pollinators. Nearly 90% of wild flowering plants depend on animal pollination to varying degrees (Ollerton et al., 2011) and pollination contributes up to 35% of global crop production volume (Klein et al., 2007; IPBES, 2016). As plant–pollinator interactions are thought to be sensitive to global climate changes through spatial or temporal mismatches or by interacting with other global drivers such as habitat loss and invasive species (Hegland et al., 2009; Schweiger et al., 2010), consequent changes in visitation rate may impact seed and fruit production in plants and crops. For example, reduced visitation rates may increase pollen limitation and decrease crop production (Allen-Wardell et al., 1998; Potts et al., 2010). Other studies have demonstrated potential climate-induced mismatches by manipulating flowering phenology and observing pollinator visitation (Rafferty & Ives, 2011; Gillespie et al., 2016). The protocols described here are relevant for studying a wide range of non-climatic anthropogenic influences on pollinator visitation such as habitat loss and fragmentation, invasive species, vegetation composition, and land-use change. Independent of any study aim, the variables can be collected as part of site census work, gradient studies, site comparisons, or plot-level experiments. However, it should be noted that it is often difficult to manipulate the pollinator side of the interaction as they operate on coarser scales than plants.
Plant–pollinator network descriptors have become common variables in the ecological literature. Network structure descriptors provide the researcher with the tools to compare communities in time and space by statistical network patterns (Bascompte et al., 2003; Olesen et al., 2008; Jordano, 2016). In particular, the structural descriptors of mutualistic networks may indicate their robustness to perturbations (Rezende et al., 2007) such as climate change (Hegland et al., 2010). While many diverse networks are considered to be robust against the perturbations associated with climate warming (Hegland et al., 2009), there is much still to learn about these food webs and global change (Schmidt et al., 2017).
4.13.1 What and how to measure?
Measuring the pollinator visitation rate necessarily includes the counting of both pollinators and flowers and is largely done non-destructively to avoid influencing the number of possible visits. However, the aim of the study influences the choice of scale (flower, plant, plot, site) and precision in the recordings. Plot-level studies often provide the best quality pollinator data, but plant-level recordings represent the highest quality data for both pollination and plant reproductive studies. Plot-level studies can be combined with plant/flower-level studies by tagging plants/flowers.
Plot-level recordings are often used for community studies where both plant and pollinator related questions are in focus. Such studies enable the observation of pollinator visitations to several plant species simultaneously and may involve the determination of pollinators to taxonomic group or species level (Hegland & Totland, 2005). Plot-level recordings are usually conducted within a set area, for example 1–5 × 1–5 m plots (or the circular equivalent), large enough to obtain the variation of plants and pollinators that are in focus and easily perceived by the observer(s) available. The plots are often permanent within or across seasons, but may also be single-census plots depending on the aim of study. First, the number of pollinator visitations to each plant is recorded within a set time-period, and second, the number of flowers or inflorescences for each flowering species is counted. The time-period of observation ranges in many studies from a few minutes to a few hours, depending on the study system and insect density. For example, in the High Arctic a low density of flying insects requires longer (e.g. 2 x 20 min per plot per day; Olesen et al., 2008) than, for example, in a temperate grassland (e.g. 1 x 10 min per plot per day; Hegland & Totland, 2005). Researchers must adapt to the system-specific properties and be guided by previous studies in similar environments (see also below).
Plant-level recordings are often used when research questions mainly relate to plant reproduction of one species (see also protocol 4.1 Plant sexual reproduction) or to pollination by specialist pollinator species. In these cases, the observations are the same as plot-level studies, but a number of individual plants or flowers of the focal species are marked and observed repeatedly. Recordings at this level are also used when observing pollinator visitation and plant reproduction at the plant level is difficult, for example in trees. In all cases, it is recommended that observations are carried out on multiple days and across multiple sites (Fijen & Kleijn, 2017).
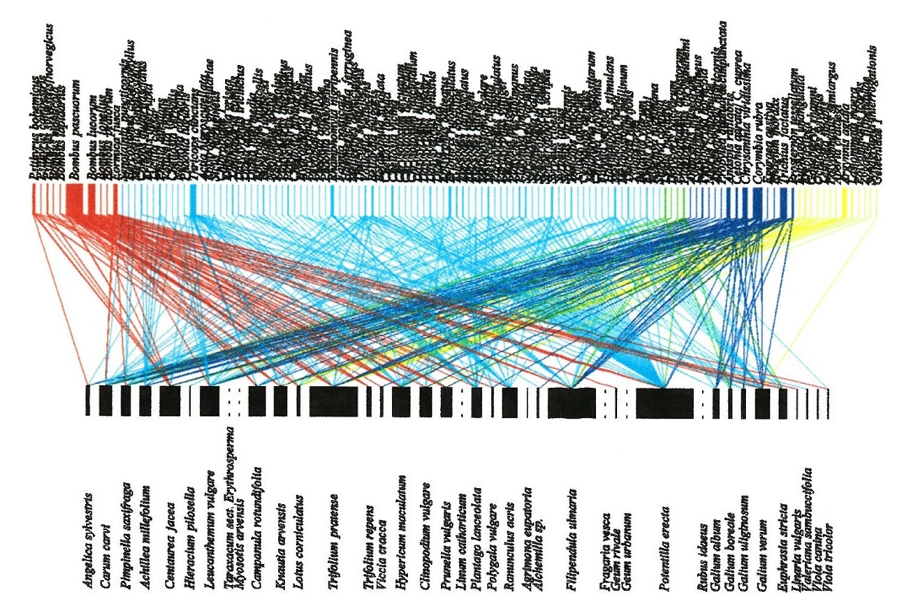
To measure network structure descriptors and interaction turnover it is necessary to construct plant–pollinator networks, which also requires the sampling of species interactions (Figure 4.13.1). This can involve either standardised observation periods (often 2 x 20-min; e.g. Olesen et al., 2008) as described above, or preferably a transect method standardised by distance, time, or both (e.g. 25 m and/or 5 min subtransect; e.g. Westphal et al., 2008; Hegland et al., 2010; see also protocol 4.12. Pollinator composition). However, at higher latitudes and elevations sufficient data may only be attainable via the observation or plot method due to low species diversity and a reduced occurrence of interactions (Olesen et al., 2008). In the transect method, the observer walks along transects recording pollinators observed feeding from flowers or capturing them by netting for later identification (Hegland et al., 2010). In both cases, the flower species is also recorded. Plant–pollinator networks are then constructed, from which descriptors can be calculated (Nielsen & Bascompte 2007; Hegland et al., 2010; Jordano, 2016).
When using permanent plots or transects it is essential to mark and map their location to enable accurate resampling. Metal tubes may be inserted into the soil for relocation with a metal detector if other aboveground markings (e.g. plastic tubes, pegs, flags) may be disturbed by grazing, trampling, or other factors. When catching pollinators for later identification, much more equipment is required (sweep-net, storage vials, preservation materials; see also protocol on 4.12. Pollinator composition) and expert taxonomists may be required to determine specimens to species level (Prys-Jones & Corbet, 2011). If transects or observation periods are to be timed, a timer is required and it is recommended that in situ weather data are collected (temperature, rainfall, cloud cover, wind speed and direction) as these may be important covariates. Where possible, observations of insect visitation should be constrained to standardised weather conditions such as calm days with no rain and relatively high temperatures above to ensure the majority of the pollinator community are in flight (Totland, 1993, 1994; Kleijn et al., 2015).
Interpretation
The most common way to use and interpret pollinator visitation data is to use the number of flower visits by a pollinator species (i.e. Bombus terrestris), a pollinator group (Bombus sp.), or all pollinators to a single or multiple flowers per unit of time (Ricketts et al., 2008; King et al., 2013; Fijen & Kleijn, 2017). Alternatively, at the plot level the number of visits to flowers in a plot divided by the number of flowers for a set time period can be calculated (Lazaro et al., 2013). However, a recent study has warned against analysing proportions as both the numerator and denominator can have distinct and unknown error distributions. It may be preferable, therefore, to analyse the number of visitors as count data and use the number of flowers as an “offset” variable (a component of the linear predictor of a Poisson model held constant, while other covariates are evaluated; Crawley, 2013) to account for sampling effect (Reitan & Nielsen, 2016). The rate of pollinator visitors to a plant or plot can be interpreted in a number of ways, depending on the research question. For example, a decline in visitation rate over time can be an indication of the effectiveness or state of the pollinator community (Ricketts et al., 2008), or, in comparative studies, as the degree of attraction of the plant/plot to insect visitors (Lazaro et al., 2013). More attractive or rewarding plant species and plots are likely to attract a greater number of total visits and, depending on the research design, visits from a wider range of species or taxonomic groups. These variables can also provide an indication of the relative size and composition of the local pollinator community, with more visits by a diverse range of pollinators expected in an area with a rich and healthy community.
When constructing plant–pollinator networks there are many potential statistics to calculate based on the two-part matrices (reviewed in Bascompte & Jordano, 2007), although care must be taken with their use as they can be sensitive to sample size (Nielsen & Bascompte, 2007). Basic metrics such as number and diversity of plant and pollinator species and the number of interactions can easily be calculated. In addition, nestedness, connectance, link density, and the degree-strength relationship are descriptors of mutualistic networks that provide an estimation of robustness against perturbations and losses in interactions (Bascompte et al., 2003; Rezende et al., 2007; Hegland et al., 2010). For example, networks with greater levels of connectance and nestedness have a stronger core of generalist species which subsequently aid the persistence of specialised interactions (Bascompte & Jordano, 2007). In general, the analysis of mutualist networks can be a complex undertaking and readers should become familiar with some key studies (see Where to start below) and theory before planning such a study.
Where to start
Bascompte & Jordano (2007), Hegland & Totland (2005), Hegland et al. (2010), Olesen et al. (2008), Rezende et al. (2007)
4.13.2 Special cases, emerging issues, and challenges
A key issue to determine is the length of time of the observation period, which depends on a number of factors. For example, the researcher should consider the time available for observations, the number of focal species, methods of studies with similar research questions, and the required sample size when choosing the time period. Furthermore, a recent study found that the minimum observation time required to accurately represent visitation rate varies between days and field locations with observations peaking in the middle of the day and at 29 ˚C (Fijen & Kleijn, 2017). Fijen & Kleijn (2017) conclude that the time taken for a set number of pollinators to visit the plot or plants may provide a more accurate estimate of visitation rate.
An additional emerging issue is the distinction between flower visitors and effective pollinators. In the absence of observations to the contrary, a flower-visiting insect touching the sexual organs of a flower may be assumed to be a pollinator and included in plant–pollinator networks (Hegland et al., 2010). However, in some cases the insect may not be effective as a pollinator, taking the floral reward without providing the pollination service, or may be an inefficient pollinator (King et al., 2013). King et al. (2013) therefore propose the use of the variable “single-visit deposition” of pollen on virgin stigmas as a more practical measure of pollinator effectiveness. They further highlight the need to consider the effectiveness of insect-visitors in plant–pollinator network studies. In the strictest sense, if data on pollen deposition or pollinator effectiveness is lacking, flower-visitors should only be considered to be pollinating if they i) come into contact with the stigma and ii) have morphological features (e.g. hairs) that would allow them to carry and deposit pollen, otherwise they should be referred to as flower-visitors.
Methods described above for constructing plant–pollinator networks are “phyto-centric” in that the focus is on the visitors to the plant species. Alternative “zoo-centric” methods, such as sampling the pollen attached to the bodies of pollinators are less common (Jordano, 2016), perhaps because they require identification of both insect and pollen species. In some cases, such as the identification of pollen attached to museum specimens (Bartomeus et al., 2011), the extra identification work is not required, however. Nevertheless, combining data from both phyto- and zoo-centric studies could provide a more complete analysis of interactions and ecosystem services provision (Jordano, 2016). Networks can be constructed as qualitative or quantitative food webs containing information on interaction strength or species abundance with the quantitative approach containing most information (Memmott, 1999).
With some extra effort, planning, and species identification, plots and data used for calculating visitation rates may also be used to derive estimates of flowering phenology, pollinator composition and diversity, plant–pollinator networks, etc. (Westphal et al., 2008; Fijen & Kleijn, 2017); see also protocol 4.5 Aboveground plant phenology and 4.12 Pollinator composition.
The field of pollinator networks is constantly developing and understanding spatial turnover, and subsequently the heterogeneity among sites or communities, is central to many biodiversity issues. For example, new metrics such as the H2’ index, which measures the degree of specialisation in networks, are thought to be more sensitive to perturbations (Blüthgen et al., 2006; Hoiss et al., 2015). Likewise, the identity of interacting species within plant–pollinator networks varies along environmental and spatial gradients (Trøjelsgaard et al., 2015), which potentially aids the long-term persistence and capacity for evolutionary adaptation under climate change (Burkle & Alarcon, 2011). The focus on interaction-turnover is relatively recent with many questions remaining unanswered (Burkle et al., 2016).
4.13.3 References
Theory, significance, and large datasets
Fijen & Kleijn (2017), Jordano (2016), King et al. (2013), Ricketts et al. (2008)
More on methods and existing protocols
Fijen & Kleijn (2017), Hegland et al. (2010), King et al. (2013)
All references
Allen-Wardell, G., Bernhardt, P., Bitner, R., Burquez, A., Buchmann, S., Cane, J., … Walker, S. (1998). The potential consequences of pollinator declines on the conservation of biodiversity and stability of food crop yields. Conservation Biology, 12, 8-17.
Bartomeus, I., Ascher, J. S., Wagner, D., Danforth, B. N., Colla, S., Kornbluth, S., & Winfree, R. (2011). Climate-associated phenological advances in bee pollinators and bee-pollinated plants. Proceedings of the National Academy of Sciences USA, 108, 20645-20649.
Bascompte, J., & Jordano, P. (2007). Plant-animal mutualistic networks: the architecture of biodiversity. Annual Review of Ecology Evolution and Systematics, 38, 567-593.
Bascompte, J., Jordano, P., Melian, C. J., & Olesen, J. M. (2003). The nested assembly of plant-animal mutualistic networks. Proceedings of the National Academy of Sciences USA, 100, 9383-9387.
Blüthgen, N., Menzel, F., & Blüthgen, N. (2006). Measuring specialization in species interaction networks. BMC Ecology, 6, art9.
Burkle, L. A., & Alarcon, R. (2011). The future of plant-pollinator diversity: understanding interaction networks across time, space, and global change. American Journal of Botany, 98, 528-538.
Burkle, L. A., Myers, J. A., & Belote, R. T. (2016). The beta-diversity of species interactions: untangling the drivers of geographic variation in plant–pollinator diversity and function across scales. American Journal of Botany, 103, 118-128.
Crawley, M. J. (2013). The R Book. Chichester: John Wiley & Sons.
Fijen, T. P. M., & Kleijn, D. (2017). How to efficiently obtain accurate estimates of flower visitation rates by pollinators. Basic and Applied Ecology, 19, 11-18.
Garibaldi, L. A., Steffan-Dewenter, I., Winfree, R., Aizen, M. A., Bommarco, R., Cunningham, S. A., … Klein, A. M. (2013). Wild pollinators enhance fruit set of crops regardless of honey bee abundance. Science, 339, 1608-1611.
Gillespie, M. A. K., Baggeson N., Cooper E. J. (2016). High Arctic flowering phenology and plant-pollinator interactions in response to delayed snow melt and simulated warming. Environmental Research Letters, 11(11): 115006.
Hegland, S. J., & Totland, Ø. (2005). Relationships between species’ floral traits and pollinator visitation in a temperate grassland. Oecologia, 145, 586-594.
Hegland, S. J., Nielsen, A., Lázaro, A., Bjerknes, A. L., & Totland, Ø. (2009). How does climate warming affect plant-pollinator interactions? Ecology Letters, 12, 184-195.
Hegland, S. J., Dunne, J., Nielsen, A., & Memmott, J. (2010). How to monitor ecological communities cost-efficiently: the example of plant-pollinator networks. Biological Conservation, 143, 2092-2101.
Hoiss, B., Krauss, J., & Steffan-Dewenter, I. (2015). Interactive effects of elevation, species richness and extreme climatic events on plant-pollinator networks. Global Change Biology, 21, 4086-4097.
IPBES. (2016). Summary for policymakers of the assessment report of the Intergovernmental Science-Policy Platform on Biodiversity and Ecosystem Services on pollinators, pollination and food production. Secretariat of the Intergovernmental Science-Policy Platform on Biodiversity and Ecosystem Services, Bonn, Germany.
Jordano, P. (2016). Sampling networks of ecological interactions. Functional Ecology, 30, 1883-1893.
King, C., Ballantyne, G., & Willmer, P. G. (2013). Why flower visitation is a poor proxy for pollination: measuring single-visit pollen deposition, with implications for pollination networks and conservation. Methods in Ecology and Evolution, 4, 811-818.
Kleijn, D., Winfree, R., Bartomeus, I., Carvalheiro, L. G., Henry, M., Isaacs, R., … Potts, S. G. (2015). Delivery of crop pollination services is an insufficient argument for wild pollinator conservation. Nature Communications, 6, art7414.
Klein, A. M., Vaissiere, B. E., Cane, J. H., Steffan-Dewenter, I., Cunningham, S. A., Kremen, C., & Tscharntke, T. (2007). Importance of pollinators in changing landscapes for world crops. Proceedings of the Royal Society B: Biological Sciences, 274, 303-313.
Lazaro, A., Jakobsson, A., & Totland, Ø. (2013). How do pollinator visitation rate and seed set relate to species’ floral traits and community context? Oecologia, 173, 881-893.
Memmott, J. (1999). The structure of a plant-pollinator food web. Ecology Letters, 2, 276-280.
Nielsen, A., & Bascompte, J. (2007). Ecological networks, nestedness and sampling effort. Journal of Ecology, 95, 1134-1141.
Olesen, J. M., Bascompte, J., Elberling, H., & Jordano, P. (2008). Temporal dynamics in a pollination network. Ecology, 89, 1573-1582.
Ollerton, J., Winfree, R., & Tarrant, S. (2011). How many flowering plants are pollinated by animals? Oikos, 120, 321-326.
Potts, S. G., Biesmeijer, J. C., Kremen, C., Neumann, P., Schweiger, O., & Kunin, W. E. (2010). Global pollinator declines: trends, impacts and drivers. Trends in Ecology & Evolution, 25, 345-353.
Prys-Jones, O. E., & Corbet, S. A. (2011). Bumblebees (3rd ed.). Exeter: Pelagic Publishing.
Rafferty, N. E., & Ives, A. R. (2011). Effects of experimental shifts in flowering phenology on plant-pollinator interactions. Ecology Letters, 14(1), 69-74.
Reitan, T., & Nielsen, A. (2016). Do not divide count data with count data; a story from pollination ecology with implications beyond. PLoS ONE, 11, :e0149129.
Rezende, E. L., Lavabre, J. E., Guimaraes, P. R., Jordano, P., & Bascompte, J. (2007). Non-random coextinctions in phylogenetically structured mutualistic networks. Nature, 448, 925-928.
Ricketts, T. H., Regetz, J., Steffan-Dewenter, I., Cunningham, S. A., Kremen, C., Bogdanski, A., … Viana, B. F. (2008). Landscape effects on crop pollination services: are there general patterns? Ecology Letters, 11, 499-515.
Schmidt, N. M., Hardwick, B., Gilg, O., Hoye, T. T., Krogh, P. H., Meltofte, H., … Roslin, T. (2017). Interaction webs in arctic ecosystems: determinants of arctic change? Ambio, 46, S12-S25.
Schweiger, O., Biesmeijer, J. C., Bommarco, R., Hickler, T., Hulme, P. E., Klotz, S., … Settele, J. (2010). Multiple stressors on biotic interactions: how climate change and alien species interact to affect pollination. Biological Reviews, 85, 777-795.
Totland, Ø. (1993). Pollination in alpine Norway: flowering phenology, insect visitors, and visitation rates in two plant communities. Canadian Journal of Botany, 71,1072-1079.
Totland, Ø. (1994). Influence of climate, time of day and season, and flower density on insect flower visitation in alpine Norway. Arctic and Alpine Research, 26, 66-71.
Trøjelsgaard, K., Jordano, P., Carstensen, D. W., & Olesen, J. M. (2015). Geographical variation in mutualistic networks: similarity, turnover and partner fidelity. Proceedings of the Royal Society B: Biological Sciences, 282(1802), 2014.2925.
Westphal, C., Bommarco, R., Carre, G., Lamborn, E., Morison, N., Petanidou, T., … Steffan-Dewenter, I. (2008). Measuring bee diversity in different European habitats and biogeographical regions. Ecological Monographs, 78, 653-671.
Authors: Hegland SJ1, Gillespie MAK1
Reviewer: Sydenham MAK2
Affiliations
1 Department of Environmental Sciences, Western Norway University of Applied Sciences, Sogndal, Norway
2 Norwegian Institute for Nature Research, Oslo, Norway