Authors: Gillespie MAK1, Hegland SJ1
Reviewers: Töpper JP2,3, Muffler L4,5
Measurable unit: various (see below); Measurement scale: plot; Equipment costs: €; Running costs: €; Installation effort: low; Maintenance effort: low; Knowledge need: low; Measurement mode: manual
Plant reproduction refers to an individual plant’s ability to produce offspring and can be vegetative or sexual. Vegetative reproduction is considered elsewhere (see protocol 4.3 Plant demography), and this section considers only reproduction via flowers and seeds. Reproduction via flowers and seeds is important for many plant species, even those capable of vegetative or clonal regeneration, because it allows the introduction of genetic variation and thus adaptation to and colonisation of new areas (Baskin & Baskin, 2014). A major issue for sexual plant reproduction today is the so-called pollinator crisis, with suggestions that the abundance and diversity of (mainly insect) pollinators have been strongly reduced in many areas of the world due to various types of global change (e.g. Biesmeijer et al., 2006; Potts et al., 2010). Plant sexual reproduction is also directly affected by climate change through different pathways. For example, various aspects of plant reproduction are likely to be sensitive to changing temperatures including flower size, flower number, seed set, seed size, seed number, and fruit to flower ratio (Arft et al., 1999; Liu et al., 2012; Meineri et al., 2014), as well as nectar and pollen production (Scaven & Rafferty, 2013). There are also documented impacts of elevated carbon dioxide and altered precipitation patterns on plant physiology, which can further affect reproductive fitness positively or negatively (Erhardt & Rusterholz, 1997; Jablonski et al., 2002; Reyer et al., 2013). These aspects of reproduction can be incorporated into protocols for observational or experimental climate-change studies, but could also be investigated as part of other global-change drivers. For example, plant sexual reproduction and plant–pollinator interactions can be affected directly and indirectly by nitrogen deposition (Hoover et al., 2012). Changes in these reproduction variables can have important impacts on community dynamics, as declining reproductive success of some species, and improved success in others, is likely to affect community composition. In particular, changes may have a cascading impact on animal populations that rely on flowers, seeds, or fruits. Pollinators may be affected by changes in flower number, flower size, nectar, and pollen amount and quality (Scaven & Rafferty, 2013). Seed and fruit consumers, including humans, will be impacted by the size, quantity, and quality of their food.
4.1.1 What and how to measure?
It is initially important to define what constitutes an “open” flower or inflorescence before beginning measurements, because plants open and wither their flowers gradually. There is little available information to construct a consensus on this, but we suggest that a flower is considered open if an insect pollinator can access the nectaries or stigma/anther (insect-pollinated plants) or that stigma and anthers are exposed (wind-pollinated plants) so that reproduction can take place. For some types of flowers it will be difficult to study a single flower and the study unit will then be the inflorescence. When counting or measuring seeds and fruits, it is important that they are ripe or mature, or that mature and immature individuals are differentiated and counted separately. For example, Pato & Ramón Obeso (2012) counted Vaccinium myrtillus seeds that were mature (“filled and large”) and aborted (“unfilled and small”) separately. The bewildering array of seed and fruit forms in nature precludes a comprehensive review of benchmarks here, but we suggest that efforts are made to establish these standards from literature covering the study species before undertaking measurements (e.g. Molau & Mølgaard, 1996). More information can also be found in protocol 4.2 Seed germinability, viability, and dormancy. These definitions are subsequently important to the timing of these measurements. Preferably, measurements should be made at frequent intervals (e.g. once every 3 to 7 days) during anthesis, but if this is not practical, single measurements should be made at peak flowering. If the plant species exhibit more than one flowering periods or peaks, the same measurements should be made for each period. If this is not possible, it is important to reference this in any subsequent reporting.
A large number of variables can be measured easily, but these are likely to depend on the target species and research question. For example, the ITEX manual (Molau & Mølgaard, 1996) suggests different reproductive response variables for different species, ranging from inflorescence length, size of individual flowers, and bulbils per shoot for Bistorta vivipara to number of flowers per plot, seeds per flower, and mean seed weight for Dryas octopetala. Despite this variation in measurement approach, the common aspects sampled by many studies often include the following (per plot or individual):
-
-
-
- Flower number
- Mean flower or inflorescence size
- Nectar produced
- Pollen produced
- Mature fruit and/or seed number
- Mature fruit and/or seed weight
-
-
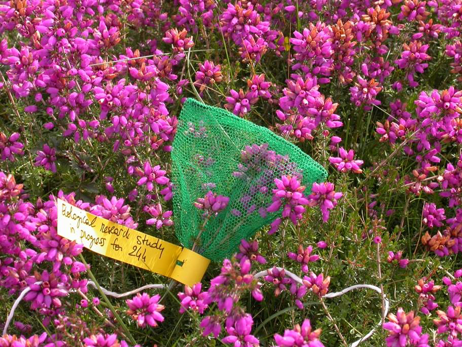
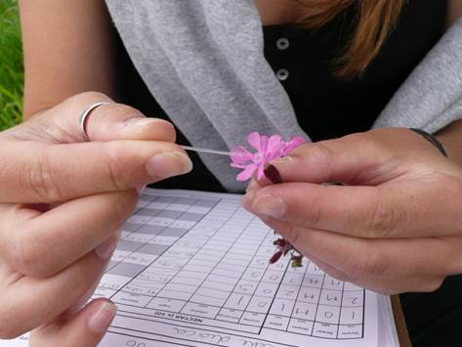
These variables can allow the calculation of other variables such as seed number per flower, seeds to ovule ratio (i.e. seed set), fruit to flower ratio (i.e. fruit set), and cumulative fitness (accumulation of traits expressed during a plant’s life; Hargreaves et al., 2014, see below). At the plot level, reproductive structures such as flowers, inflorescences, and fruits can easily be counted, and it is recommended that these are combined with percent cover estimates of flowers. However, this method may result in the underrepresentation of less common species. It may therefore be preferable to mark up to 20 plants, genets, or ramets per plot for each of the most common species as recommended by ITEX (Molau & Mølgaard, 1996) and count the number of reproductive structures per individual. Plot size will therefore be relative to the size and density of the target species. Alternatively, some counts can be conducted at the plot level, in which case we recommend plot sizes of 0.5 m2 for dominant forbs and low-growing shrubs (e.g. Baude et al., 2016), 1-4 m2 for sparser or larger vegetation (e.g. Gillespie et al., 2017), and up to 0.25 ha for trees (Carrer et al., 2018). In addition, fruits, seeds, seed heads, catkins, capsules, or other seed structures can be collected for weighing, dissecting, and counting at the laboratory. Fruits can be collected in small plastic zip-lock bags if freezing or refrigerating (Pérez-Harguindeguy et al. 2013), otherwise these and seeds/seed structures can be collected in paper bags. Between collection and further processing, fruits can be kept frozen in plastic bags (for longer periods) or at room temperature in paper bags (e.g., if germination experiments are to be conducted; see Molau & Mølgaard ,1996), and seeds can be kept in a dry place at room temperature for two months (Molau & Mølgaard, 1996). Nectar and pollen production requires slightly more time and effort. To sample nectar, flowers should be bagged with fine mesh for 24 hours to allow the nectaries to fill without being depleted by insects (Figure 4.1.1 left). Nectar should then be extracted using microcapillaries (Figure 4.1.1 right) or rinsing techniques before being analysed for sugar content with a refractometer modified for small volumes (Baude et al., 2016). Pollen grains can be counted under a microscope and are sampled by collecting the anthers of freshly opened flowers (Baude et al., 2016).
 |
 |
|
Figure 4.1.1 Nectar sampling. An Erica cinerea ramet enclosed in a net bag to exclude insect pollinators (left). Extracting floral nectar using a microcapillary pipette (right). Photos: Mathilde Baude. |
|
When plants are exposed to treatments or repeated observations the individual plants or flowers, or plots, need to be mapped and tagged for resampling or for later collection of reproductive units. Individual plants can be marked with metal tags as suggested in Molau & Mølgaard (1996), although the authors of this protocol have previously used various other methods such as cut lengths of drinking straws or cable ties and colour beads. The method of tagging is not important and is not usually reported in studies, but plants should be given individual codes written onto the tag with permanent marker or be assigned a colour-coding scheme. Note that it can be difficult to find markings later in the season in locations where the vegetation is likely to grow significantly. Large herbivores may also remove markings accidentally, so researchers should consider whether it is appropriate to erect plot, block, or site fencing. At the plot level, metal tubes can make useful markers as they can be inserted into the soil for later recovery with a metal detector if aboveground markings may be disturbed by herbivory, trampling, or other factors. They can also serve as corner holders for frame quadrats. Alternatively, plastic tubing can make suitable plot markers (e.g. Cooper et al., 2011), although they tend to be attractive to grazing animals.
Interpretation of the variables covered here is straightforward. The variables can be interpreted as the reproductive effort of a plant (e.g. Arft et al., 1999; Lambrecht et al., 2007; Barrett & Hollister, 2016) or its reproductive fitness (e.g. Marchin et al., 2014; Xiao et al., 2016; Lemoine et al., 2017). The figures derived alone will not necessarily be meaningful, but the comparison of these variables between treatments or against baseline data can provide a picture of a species’ reproductive fitness and differences or changes in reproductive effort. For example, individual plants with relatively more and larger flowers or inflorescences, and a higher production of nectar and/or pollen can be considered to make a greater reproductive effort because they are more likely to attract pollinators and have higher chances of seed production and dispersal. Similarly, those individuals with relatively more or heavier seeds can be said to have greater reproductive fitness, because the chances of successful reproduction are higher. In some studies spanning numerous sites or landscapes, care should be taken over these interpretations because reproductive variables can vary widely between populations and locations (Breza et al., 2012) and with local environmental conditions (Fernández et al., 2015). Reproductive variables can also be size dependent within species and populations (Meineri et al., 2014). For these reasons, it may be advisable to include covariates such as temperature, soil moisture, relative humidity, precipitation, and plant size in any statistical analysis (Meineri et al., 2014).
Fitness is a relative measure of reproductive success and can be estimated from reproduction. It is used to assess local adaptation among populations from different habitats (Kawecki & Ebert, 2004) and a standard response variable in reciprocal transplant experiments and common gardens. It can be advisable to assess cumulative fitness (e.g. mean survival probability per population X mean number of inflorescences per population; Joshi et al., 2001; Halbritter et al., 2015), which often cannot be estimated from the performance of a subset of life stages (e.g. number of flowers or seed set; Hargreaves et al., 2014). A plant can, for example, produce flowers and seeds, but the seeds are not fertile.
Where to start
Arft et al. (1999), Molau & Mølgaard (1996), Reyer et al. (2013)
4.1.2 Special cases, emerging issues, and challenges
If the aim of the study is to assess the importance of animal pollination to sexual reproduction it may be important to combine data collection on plant reproduction with assessments of pollinator visitation (see protocol 4.12 Pollinator visitation). In addition, for a more detailed insight on the importance of pollinators to plant reproduction one should include pollen limitation experiments (Burd, 1994; Ashman et al., 2004). By comparing reproductive output from supplemental hand-pollinated flowers with flowers that receive in situ flower visitation (open-pollinated), one may estimate whether female reproduction in a given environment is pollen limited. Comparing bagged flowers with open pollinated flowers can further allow an assessment of the importance of pollinators in plant sexual reproduction in a given environment. To estimate population and fitness consequences of global changes researchers may also need to germinate seeds, for example in a seed-sowing experiment (Hegland & Totland, 2007; see protocol 4.2 Seed viability, germinability and dormancy), or by performing population modelling (Ashman et al., 2004; protocol 4.3 Plant demography). Reproductive data are essential parts of demographic studies and data on seed and fruit yields, germination rates, and offspring survival are essential for the construction of demographic models.
Recent work on plant nectar production has investigated the “scaling-up” of plant-level measurements to habitat- and countrywide-scale estimates of nectar production. Baude et al. (2016) measured the nectar production for 175 common British plant species and modelled the nectar of a number of others and combined these values with survey data of plant species cover in a range of British habitat types and remotely sensed habitat cover for the entire country. Although the nectar measurements were from only two populations at most, the estimates demonstrated the most productive habitats and regions in the country. Such upscaling of plant traits could be further explored in other habitats and regions and in combination with other variables. Furthermore, a database of such traits could be maintained and added to when additional measurements are available for future modelling efforts (Baude et al., 2016).
4.1.1 References
Theory, significance, and large datasets
Arft et al. (1999), Baude et al. (2016), Scaven & Rafferty (2013)
More on methods and existing protocols
Baude et al. (2016), Molau & Mølgaard (1996)
All references
Arft, A. M., Walker, M. D., Gurevitch, J., Alatalo, J. M., Bret-Harte, M. S., Dale, M., … Wookey, P. A. (1999). Responses of tundra plants to experimental warming: Meta-analysis of the international tundra experiment. Ecological Monographs, 69, 491-511.
Ashman, T. L., Knight, T. M., Steets, J. A., Amarasekare, P., Burd, M., Campbell, D. R., … Wilson, W. G. (2004). Pollen limitation of plant reproduction: ecological and evolutionary causes and consequences. Ecology, 85, 2408-2421.
Baskin, C. C., & Baskin, J. M. (2014). Seeds: Ecology, Biogeography, and Evolution of Dormancy and Germination (2nd ed.). Elsevier.
Barrett, R. T., & Hollister, R. D. (2016). Arctic plants are capable of sustained responses to long-term warming. Polar Research, 35, 9.
Baude, M., Kunin, W. E., Boatman, N. D., Conyers, S., Davies, N., Gillespie, M. A. K., … Memmott, J. (2016). Historical nectar assessment reveals the fall and rise of floral resources in Britain. Nature, 530, 85-88.
Biesmeijer, J. C., Roberts, S. P. M., Reemer, M., Ohlemuller, R., Edwards, M., Peeters, T., … Kunin, W. E. (2006). Parallel declines in pollinators and insect-pollinated plants in Britain and the Netherlands. Science, 313, 351-354.
Breza, L. C., Souza, L., Sanders, N. J., & Classen, A. T. (2012). Within and between population variation in plant traits predicts ecosystem functions associated with a dominant plant species. Ecology and Evolution, 2, 1151-1161.
Burd, M. (1994). Bateman principle and plant reproduction: the role of pollen limitation in fruit and seed set. Botanical Review, 60, 83-139.
Carrer, M., Castagneri, D., Popa, I., Pividori, M., & Lingua, E. (2018). Tree spatial patterns and stand attributes in temperate forests: The importance of plot size, sampling design, and null model. Forest Ecology and Management, 407, 125-134.
Cooper, E. J., Dullinger, S., & Semenchuk, P. (2011). Late snowmelt delays plant development and results in lower reproductive success in the High Arctic. Plant Science, 180, 157-167.
Erhardt, A., & Rusterholz, H. P. (1997). Effects of elevated CO2 on flowering phenology and nectar production. Acta Oecologica, 18, 249-253.
Fernández, J. D., Lorite, J., Bosch, J., & Gómez, J. M. (2015). Variation in the reproductive success of a narrow endemic plant: Effects of geographical distribution, abiotic conditions and pollinator community composition. Basic and Applied Ecology, 16, 375-385.
Gillespie, M., Baude, M., Biesmeijer, J. C., Boatman, N. D., Budge, G. E., Crowe, A., … Kunin, W. E. (2017). A method for the objective selection of landscape-scale study regions and sites at the national level. Methods in Ecology and Evolution, 8(11), 1468-1476.
Halbritter, A. H., Billeter, R., Edwards, P. J., & Alexander, J. M. (2015). Local adaptation at range edges: comparing elevation and latitudinal gradients. Journal of Evolutionary Biology, 28(10), 1849-1860.
Hargreaves, A. L., Samis, K. E., & Eckert, C. G. (2014). Are species’ range limits simply niche limits writ large? A review of transplant experiments beyond the range. The American Naturalist, 183(2), 157-173.
Hegland, S. J., & Totland, Ø. (2007). Pollen limitation affects progeny vigour and subsequent recruitment in the insect-pollinated herb Ranunculus acris. Oikos, 116, 1204-1210.
Hoover, S. E. R., Ladley, J. J., Shchepetkina, A. A., Tisch, M., Gieseg, S. P., & Tylianakis, J. M. (2012). Warming, CO2, and nitrogen deposition interactively affect a plant-pollinator mutualism. Ecology Letters. 15(3), 227-234.
Jablonski, L. M., Wang, X. Z., & Curtis, P. S. (2002). Plant reproduction under elevated CO2 conditions: a meta-analysis of reports on 79 crop and wild species. New Phytologist, 156, 9-26.
Joshi, J., Schmid, B., Caldeira, M. C., Dimitrakopoulos, P. G., Good, J., Harris, R., … Mulder, C. P. H. (2001). Local adaptation enhances performance of common plant species. Ecology Letters, 4(6), 536-544.
Kawecki, T. J., & Ebert, D. (2004). Conceptual issues in local adaptation. Ecology Letters, 7(12), 1225-1241.
Lambrecht, S. C., Loik, M. E., Inouye, D. W., & Harte, J. (2007). Reproductive and physiological responses to simulated climate warming for four subalpine species. New Phytologist, 173, 121-134.
Lemoine, N. P., Doublet, D., Salminen, J. P., Burkepile, D. E., & Parker, J. D. (2017). Responses of plant phenology, growth, defense, and reproduction to interactive effects of warming and insect herbivory. Ecology, 98, 1817-1828.
Liu, Y., Mu, J., Niklas, K. J., Li, G., & Sun, S. (2012). Global warming reduces plant reproductive output for temperate multi-inflorescence species on the Tibetan plateau. New Phytologist, 195, 427-436.
Marchin, R. M., Dunn, R. R., & Hoffmann, W. A. (2014). Are winter-active species vulnerable to climate warming? A case study with the wintergreen terrestrial orchid, Tipularia discolor. Oecologia, 176, 1161-1172.
Meineri, E., Skarpaas, O., Spindelböck, J., Bargmann, T., & Vandvik, V. (2014). Direct and size-dependent effects of climate on flowering performance in alpine and lowland herbaceous species. Journal of Vegetation Science, 25, 275-286.
Molau, U., & Mølgaard, P. (1996). ITEX Manual – International Tundra Experiment (2nd ed.) Copenhagen: Danish Polar Centre. http://ibis.geog.ubc.ca/itex/PDFs/ITEXmanual.pdf
Pato, J. & Ramón Obeso, J. (2012). Growth and reproductive performance in bilberry (Vaccinium myrtillus) along an elevation gradient. Ecoscience, 19(1), 59-68.
Pérez-Harguindeguy, N., Diaz, S., Garnier, E., Lavorel, S., Poorter, H., Jaureguiberry, P., … Cornelisson, J. H. C. (2013). New handbook for standardised measurement of plant functional traits worldwide. Australian Journal of Botany, 61(3), 167-234.
Potts, S. G., Biesmeijer, J. C., Kremen, C., Neumann, P., Schweiger, O., & Kunin, W. E. (2010). Global pollinator declines: trends, impacts and drivers. Trends in Ecology & Evolution, 25, 345-353.
Reyer, C. P. O., Leuzinger, S., Rammig, A., Wolf, A., Bartholomeus, R. P., Bonfante, A., … Pereira, M. (2013). A plant’s perspective of extremes: terrestrial plant responses to changing climatic variability. Global Change Biology, 19, 75-89.
Scaven, V. L., & Rafferty, N. E. (2013). Physiological effects of climate warming on flowering plants and insect pollinators and potential consequences for their interactions. Current Zoology, 59, 418-426.
Xiao, Y., Li, X. H., Cao, Y. S. & Dong, M. (2016). The diverse effects of habitat fragmentation on plant-pollinator interactions. Plant Ecology, 217, 857-868.
Authors: Gillespie MAK1, Hegland SJ1
Reviewers: Töpper JP2,3, Muffler L4,5
Affiliations
1 Department of Environmental Sciences, Western Norway University of Applied Sciences, Sogndal, Norway
2 Norwegian Institute for Nature Research, Bergen, Norway
3 Department of Biological Sciences, University of Bergen, Bergen, Norway
4 Experimental Plant Ecology, Institute of Botany and Landscape Ecology, University of Greifswald, Greifswald, Germany
5 Plant Ecology, Albrecht-von-Haller Institute for Plant Sciences, University of Goettingen, Goettingen, Germany