Authors: Gillespie MAK1, Hegland SJ1
Reviewer: Sydenham MAK2
Measurable unit: number of individuals/species, various indices; Measurement scale: site; Equipment costs: €; Running costs: €; Installation effort: low; Maintenance effort: low; Knowledge need: high; Measurement mode: manual
Pollinators are usually insects that assist a wide range of flowering plants with pollination, i.e. they visit flowers to feed on nectar or pollen and inadvertently transport pollen to conspecific flowers. Sampling pollinators in experimental or observational studies can provide variables of community composition, species richness, and pollinator abundance. Pollination is important for a range of flowering species that rely on animals for cross-pollination (Ollerton et al., 2011), and both the composition and diversity of the pollinating community of a particular habitat can be important drivers of plant fitness, productivity, and biodiversity (Hoehn et al., 2008; Bartomeus et al., 2013). Pollinator communities are thought to be particularly sensitive to climate change through spatial and temporal mismatches between pollinators and their food plants (Hegland et al., 2009; Gonzalez-Varo et al., 2013). These changes may occur due to different changes in distribution and/or phenology of interacting species (Hegland et al., 2009) and are likely to impact vegetation community composition, agriculture, and the tolerance of habitats and ecosystems to changes (Gonzalez-Varo et al., 2013). Such effects are best studied over long time periods, but the potential for mismatch can be investigated using plot-level manipulations (e.g. Rafferty & Ives, 2012). At much broader scales, changes in pollinator community composition, diversity, and abundance can drive local or regional extinctions of key species and specialist plants and animals (Allen-Wardell et al., 1998) with habitat fragmentation and loss as the most important global driver (Potts et al., 2010). The protocols detailed here can therefore be used at a range of scales to study a number of global-change drivers. In general, serious impacts on food production have also been forecast in the event of severe declines in pollinator communities and diversity (Gallai et al., 2009), although it is often the more generalist and common species that contribute the most per capita to crop-pollination (Kleijn et al., 2015; Senapathi et al., 2015). Nevertheless, in acknowledgement of the role pollinators play in both agricultural and wild ecosystems, many countries have, or are developing pollinator monitoring protocols (Westphal et al., 2008; Gezon et al., 2015).
4.12.1 What and how to measure?
There are a number of ways to assess the pollinator community of a site, with varying degrees of accuracy and time and skill required. The most common method, which is used by some established national monitoring schemes, involves collecting pollinators by pan-trapping, sweep netting, or a combination of the two (Westphal et al., 2008; Gezon et al., 2015). A plot-level approach can be taken, particularly when combined with plant studies (see also protocol 4.13 Pollinator visitation), but it should be noted that pan traps are active traps in that they attract flying insects from an unknown area. They are, therefore, only likely to be suitable for landscape scale studies that use natural gradients as a proxy for manipulations, (e.g. space for time substitutions, Blois et al. 2013). Pan traps usually consist of a cluster of circular bowls measuring approximately 15 cm in diameter, each sprayed with UV reflecting paint. A combination of coloured bowls to reflect the prevailing flower colours in the region is usually selected to account for the range of colour preferences of local flower visitors. For example, one white, one yellow, and one blue bowl for each trap is commonly employed in northern Europe (Westphal et al., 2008). The bowls should be installed at the height of the surrounding vegetation and placed no closer than 5 m apart to avoid inter-trap competition (Droege et al., 2010). In short vegetation (e.g. grasslands, tundra), the bowls can simply be placed on the ground or held in place using a stake. Mounting the bowls on a large stake is recommended for taller vegetation types. Bowls should be half filled with water and a drop of liquid detergent added to break the surface tension. Traps are often emptied before 48 h (Westphal et al., 2008) after setup to prevent decomposition of the insect material. The trapping time may be shorter due to practical considerations or high insect abundance, but normally covers at least one flying day, i.e. 12 daytime hours. For longer trapping periods (e.g. a week), a mixture of water and clear propylene glycol (50:50) can be used (Rubene et al., 2015), although this approach incurs the risk of rainfall diluting the mixture and causing it to overflow as well as masking of the reflecting surface of the bowls due to the greater volume of insects. Propylene glycol acts as a preserving agent in this mixture, but other work has suggested that antifreeze for mobile home drinking water systems could provide a less toxic (although less effective) alternative (Thomas 2008). Traps should ideally be placed out in standardised weather (e.g. relatively high temperature, low wind, no rain) to ensure as many species are flying as possible or record the weather variables to control for their influence. To remove captured material, the liquid should be preserved (particularly if it contains glycol) by sieving over another trap or other vessel, and the insects emptied into a plastic ziplock bag. The specimens can then be frozen before drying and mounting or identifying. If specimens cannot be frozen on the day of removal, a quick spray of hand sanitizer or ethanol will help with preservation. Storing in ethanol should be avoided where possible, as it can fade the colouration of species like bumblebees.
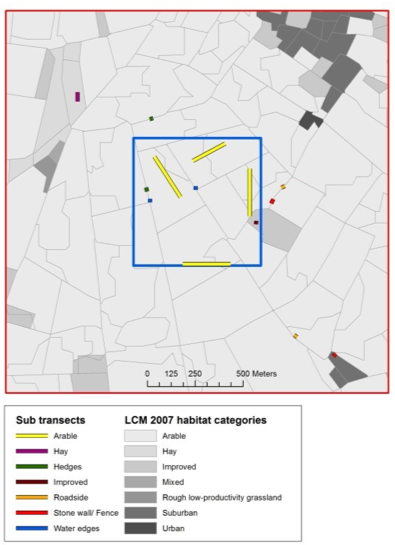
For sweep-netting approaches (also see protocol 4.11 Macroinvertebrates community compisition), the only installation required is to determine the location of transects and the time when surveys are conducted. If the aim of the study is to survey as much of the community of a site as possible, it may be desirable to place temporary transects deliberately through a range of habitats at peak flowering, and complete those transects at different times of the day to capture early and later flying insects. Alternatively, variable transects can be chosen whereby observers walk steadily in a set direction passing from one cluster of floral resources to the next, rather than along a fixed straight line (Westphal et al., 2008). However, if the study question requires a more representative and/or random sample of a set area, it is recommended that transects are placed remotely before fieldwork to avoid bias, and that the order of transects are randomised during each sampling session. For example, in a pollinator study of British landscapes, Gillespie et al. (2017) allocated sub-sections of a 1-km transect proportionately depending on the areal cover of different habitat types (Figure 4.12.1).
More recently, studies have shown that vane-traps (hanging bowls or bottles with cross-vane panels mounted at the opening) may provide a complementary method for sampling wild bees as they capture species not caught by pan traps and sweep-netting (Rhoades et al., 2017; Figure 4.12.2). The sampling protocol for vane traps largely follows that of pan traps and is not discussed in detail here. In general, the choice of method depends on resources available and the research question. While the trapping methods are less labour intensive than sweep-netting, they only provide information on the presence and relative abundance of pollinator species, whereas sweep-netting allows the recording of plant species visited and the construction of plant–pollinator networks (see protocol 4.13 Pollinator visitation). Furthermore, while pan traps attract a wide range of pollinators, the method can under-sample larger and stronger flying insects (Cane et al., 2000) and the choice of trap colour and trapping date can bias the sample (Wilson et al., 2008). Moreover, the efficiency of different colours of pan traps depends on the background vegetation which can act as a confounding factor that is difficult to measure (Saunders & Luck, 2013; see below). Overall, pan traps and sweep-netting may reveal similar species compositions, but pan traps have been found to catch more specimens and to be the superior method of the two in terms of detecting species richness (Westphal et al. 2008). Whichever method is chosen, it is recommended that sites are sampled several times during the flying season of target species as many pollinators have seasonal flight activity patterns (Oertli et al., 2005).
 |
 |
|
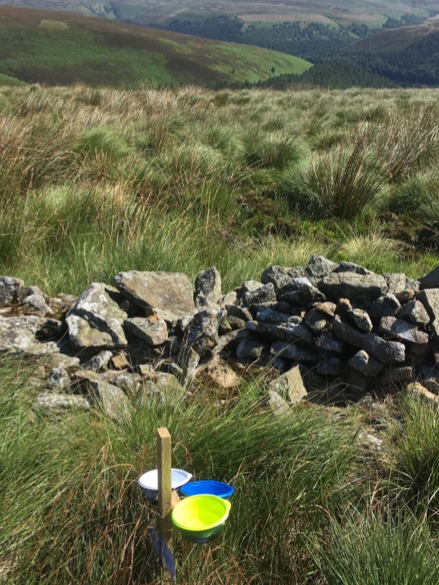
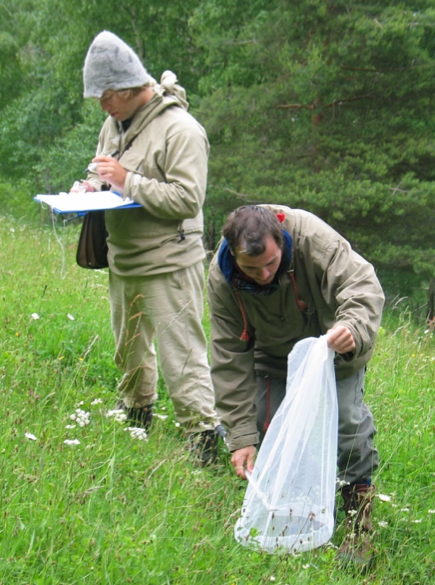
Figure 4.12.2 Different pollinator traps. A cluster of pan traps set up to collect pollinators (left). Photo: Catherine Jones. Sweep-netting for pollinators along a predetermined transect (right). Photo: Stein Joar Hegland. |
|
A further consideration for method choice and sampling schedule is the expense of post-capture identification. While some netted insects can be identified to species in the field depending on collector skill, all methods often require a large post-trapping effort to identify all specimens to species level. Depending on the trapping effort and availability of skilled taxonomists, this can be time-consuming and expensive. For this reason, all sampled insects must be placed in a preservation medium (e.g. >80% ethanol) or frozen for storage before pinning, labelling, and identification.
Following the identification of insect material, several variables can be derived: total number of insects and of each species group, species richness and diversity indices of the total catch and for each group, and species composition are the most common. Species composition data are the most detailed as they do not require the data to be summarised into a single metric, but these matrices are also sometimes the most challenging to interpret and analyse. A number of multivariate statistical approaches exist to analyse compositional data, from exploratory approaches such as principal component analysis to more comparative approaches such as canonical analysis (Legendre & Legendre, 2012). Conversely, species abundance, richness, and diversity data can be used as dependent variables in most univariate statistical approaches. However, while diversity indices (see also protocol 4.8. Plant community composition) are designed to try and capture aspects of abundance and species richness in a single figure, each index is thought to be biased in some way and is the subject of debate (Loreau, 2010). The researcher should therefore consider carefully which index is most relevant to the research question. Furthermore, care should be taken when interpreting data from pan traps as it is difficult to ascertain the boundaries of the trapping area.
Bronze standard
Pollinators of some species can be sampled by visual observation or via netting using the transect method outlined above but without the use of taxonomists to identify specimens to species level. This method requires either good identification skills of the observer, or the use of a more coarse identification system whereby species are classified according to their size, to a broader taxonomic classification scheme (e.g. bumblebees, honeybees, solitary bees, hoverflies, other flies, wasps) or by their functional traits (e.g. long-tongued v. short-tongued bees). The specific grouping will depend on the system studied and the research questions. Group-level approaches are often precise enough to answer broad ecological questions (e.g. Hegland & Totland, 2012).
Where to start
Gezon et al. (2015), Gillespie et al. (2017), Hegland & Totland (2012), Westphal et al. (2008)
4.12.2 Special cases, emerging issues, and challenges
Perhaps one of the main issues with this protocol is that it is often not possible to define the scale of the study. As flying insects are mobile organisms with ranges that vary from species to species (10 km for honey bees, 100 m for some parasitoid wasp species), it can be impossible to determine the boundary of the study area. This may be less of a problem for central-place foragers (e.g. bees) that show steep decay curves in abundance as the distance to source habitats increase than for non-central-place foragers (e.g. hoverflies) which are more ephemerally distributed throughout the landscape (Jauker et al., 2009). For single site, plot-level studies this renders the protocol to be more of a background data-gathering procedure. For wider, landscape scale studies the protocol can be a useful sampling procedure, but it is important that the study landscapes are sufficiently separated in space to avoid overlapping populations. Gillespie et al. (2017), for example, ensured that study landscapes were at least 6 km apart.
A further challenge to researchers is the placement of traps on site, which is also dependent on the research question. For example, to attempt to complete a census of a single site, Westphal et al. (2008) set out 5 traps spaced 15 m apart. In contrast, to compare pollinator composition between field sites, Gillespie et al. (2017) placed 5 traps within a 660 x 660 m study square, with traps no closer than 50 m apart. Furthermore, the capture of pollinating insects in pan traps depends in part on the amount of floral resources in the local area (Dafni et al., 2005). Pan traps are supposed to simulate a food source to adult insects, so if there are a lot of floral resources available in the landscape, the appearance and attraction of the traps may be diminished compared to landscapes with fewer floral resources. In any case, it is recommended to record the number and types of flowers in the immediate (1 m radius) vicinity of the trap to use as a covariate in analysis. Vegetation information on wider scales may also be needed, although this has not been explored adequately to date.
Despite the above uncertainties, these methods often result in a large number of specimens and any collection will contain an enormous range of information. For example, many non-target species will be caught in pan traps and these specimens can themselves hold important information about the study areas. It is recommended that they are preserved and expertise sought to identify these insects further. For example, following a pollination study in the UK comparing organic and conventional agricultural landscapes (Gabriel et al., 2013), the “by-catch” was examined for tachinid fly specimens and a further paper published addressing a similar research question (Inclan et al., 2014).
4.12.3 References
Theory, significance, and large datasets
Dafni et al. (2005), Droege et al. (2010), Gezon et al. (2015), Legendre & Legendre (2012), Westphal et al. (2008)
More on methods and existing protocols
Bartomeus et al. (2013), Cane et al. (2000), Gillespie et al. (2017), Rhoades et al. (2017), Rubene et al. (2015), Saunders & Luck (2013)
All references
Allen-Wardell, G., Bernhardt, P., Bitner, R., Burquez, A., Buchmann, S., Cane, J., … Walker, S. (1998). The potential consequences of pollinator declines on the conservation of biodiversity and stability of food crop yields. Conservation Biology, 12, 8-17.
Bartomeus, I., Park, M. G., Gibbs, J., Danforth, B. N., Lakso, A. N., & Winfree, R. (2013). Biodiversity ensures plant–pollinator phenological synchrony against climate change. Ecology Letters, 16, 1331-1338.
Blois, J. L., J. W. Williams, M. C. Fitzpatrick, S. T. Jackson, & S. Ferrier. 2013. Space can substitute for time in predicting climate-change effects on biodiversity. Proceedings of the National Academy of Sciences 110(23), 9374-9379
Cane, J. H., Minckley R. L., & Kervin, L. J. (2000). Sampling bees (Hymenoptera: Apiformes) for pollinator community studies: Pitfalls of pan-trapping. Journal of the Kansas Entomological Society, 73, 225-231.
Dafni, A., Kevan, P. G., & Husband, B. C. (Eds.) (2005). Practical Pollination Ecology. Cambridge, Ontario: Enviroquest.
Droege, S., Tepedino, V. J., Lebuhn, G., Link, W., Minckley, R. L., Chen, Q., & Conrad, C. (2010). Spatial patterns of bee captures in North American bowl trapping surveys. Insect Conservation and Diversity, 3, 15-23.
Gabriel, D., Sait, S. M., Kunin, W. E., & Benton, T. G. (2013). Food production vs. biodiversity: comparing organic and conventional agriculture. Journal of Applied Ecology, 50, 355-364.
Gallai, N., Salles, J.-M., Settele, J. & Vaissière, B. E. (2009). Economic valuation of the vulnerability of world agriculture confronted with pollinator decline. Ecological Economics, 68(3), 810-821.
Gezon, Z. J., Wyman, E. S., Ascher, J. S., Inouye, D. W., & Irwin, R. E. (2015). The effect of repeated, lethal sampling on wild bee abundance and diversity. Methods in Ecology and Evolution, 6, 1044-1054.
Gillespie, M. A. K., Baude, M., Biesmeijer, J., Boatman, N., Budge, G. E., Crowe, A., … Kunin, W. E. (2017). A method for the objective selection of landscape-scale study regions and sites at the national level. Methods in Ecology and Evolution, 8(11), 1468-1476.
Gonzalez-Varo, J. P., Biesmeijer, J. C., Bommarco, R., Potts, S. G., Schweiger, O., Smith, H. G., … Vila, M. (2013). Combined effects of global change pressures on animal-mediated pollination. Trends in Ecology & Evolution, 28, 524-530.
Hegland, S. J., & Totland, Ø. (2012). Interactions for pollinator visitation and their consequences for reproduction in a plant community. Acta Oecologica, 43, 95-103.
Hegland, S. J., Nielsen, A., Lázaro, A., Bjerknes, A. L., & Totland, Ø. (2009). How does climate warming affect plant-pollinator interactions? Ecology Letters, 12, 184-195.
Hoehn, P., Tscharntke, T., Tylianakis, J. M., & Steffan-Dewenter, I. (2008). Functional group diversity of bee pollinators increases crop yield. Proceedings of the Royal Society B: Biological Sciences, 275, 2283-2291.
Inclan, D. J., Cerretti, P., & Marini, L. (2014). Interactive effects of area and connectivity on the diversity of tachinid parasitoids in highly fragmented landscapes. Landscape Ecology, 29, 879-889.
Jauker, F., Diekötter, T., Schwarzbach, F., & Wolters, V. (2009). Pollinator dispersal in an agricultural matrix: opposing responses of wild bees and hoverflies to landscape structure and distance from main habitat. Landscape Ecology, 24, 547-555.
Kleijn, D., Winfree, R., Bartomeus, I., Carvalheiro, L. G., Henry, M., Isaacs, R., … Potts, S. G. (2015). Delivery of crop pollination services is an insufficient argument for wild pollinator conservation. Nature Communications, 6, art7414.
Legendre, P., & Legendre, L. (2012). Numerical Ecology (3rd English ed.). Amsterdam: Elsevier.
Loreau, M. (2010). The Challenges of Biodiversity Science. Oldendorf/Luhe: International Ecology Institute.
Oertli, S., Muller, A., & Dorn, S. (2005). Ecological and seasonal patterns in the diversity of a species-rich bee assemblage (Hymenoptera: Apoidea: Apiformes). European Journal of Entomology, 102(1), 53-63.
Ollerton, J., Winfree, R., & Tarrant, S. (2011). How many flowering plants are pollinated by animals? Oikos, 120, 321-326.
Potts, S. G., Biesmeijer, J. C., Kremen, C., Neumann, P., Schweiger, O., & Kunin, W. E. (2010). Global pollinator declines: trends, impacts and drivers. Trends in Ecology & Evolution, 25, 345-353.
Rafferty, N.E. & Ives, A.R. (2012) Pollinator effectiveness varies with experimental shifts in flowering time. Ecology, 93(4), 803-814.
Rhoades, P., Griswold, T., Waits, L., Bosque-Perez, N. A., Kennedy, C. M., & Eigenbrode, S. D. (2017). Sampling technique affects detection of habitat factors influencing wild bee communities. Journal of Insect Conservation, 21, 703-714.
Rubene, D., Schroeder, M., & Ranius, T. (2015). Estimating bee and wasp (Hymenoptera: Aculeata) diversity on clear-cuts in forest landscapes – an evaluation of sampling methods. Insect Conservation and Diversity, 8, 261-271.
Saunders, M. E., & Luck, G. W. (2013). Pan trap catches of pollinator insects vary with habitat. Australian Journal of Entomology, 52, 106-113.
Senapathi, D., Carvalheiro, L. G., Biesmeijer, J. C., Dodson, C. A., Evans, R. L., McKerchar, M., … Potts, S. G. (2015). The impact of over 80 years of land cover changes on bee and wasp pollinator communities in England. Proceedings of the Royal Society B: Biological Sciences, 282, 8.
Thomas, D B, 2008. Nontoxic antimfreeze for insect traps. Entomological News. 119(4), 361-365
Westphal, C., Bommarco, R., Carre, G., Lamborn, E., Morison, N., Petanidou, T., … Steffan-Dewenter, I. (2008). Measuring bee diversity in different European habitats and biogeographical regions. Ecological Monographs, 78, 653-671.
Wilson, J. S., Griswold T., & Messinger, O. J. (2008). Sampling bee communities (Hymenoptera: Apiformes) in a desert landscape: Are pan traps sufficient? Journal of the Kansas Entomological Society, 81, 288-300.
Authors: Gillespie MAK1, Hegland SJ1
Reviewer: Sydenham MAK2
Affiliations
1 Department of Environmental Sciences, Western Norway University of Applied Sciences, Sogndal, Norway
2 Norwegian Institute for Nature Research, Oslo, Norway