Author: Birkemoe T1
Reviewers: Sverdrup-Thygeson A2, Gillespie MAK3, Eycott AE4,5
Measurement unit: number or relative abundance per area; Measurement scale: plot; Equipment costs: €; Running costs: €; Installation effort: low to medium; Maintenance effort: medium to high; Knowledge need: high (species knowledge); Measurement mode: manual
Terrestrial macroinvertebrates, that is invertebrates generally above 2 mm in size, mainly include insects, spiders, millipedes, centipedes, molluscs, and crustaceans (isopods), and most assemblages are functionally diverse, with high numbers of detritivores, fungivores, herbivores, and predators. Invertebrates, therefore, can significantly affect primary production, nutrient cycling, and decomposition. From a global perspective, macroinvertebrates are likely to modify responses of ecosystem processes to climate and global change. The high functional diversity and large number of interactions between macroinvertebrates and vegetation, fungi, and dead organic matter strongly suggest incorporating these into studies of terrestrial ecosystems and certainly into ongoing climate-change studies.
Macroinvertebrates vary from millimetres to centimetres in size and range from sedate species living their entire life on a few square metres to highly active species covering many kilometres during their lifetime. Many species also have life stages with highly different habitat requirements, such as some Lepidoptera that have herbivorous larvae but adults that feed on floral nectar. The effect of macroinvertebrates on vegetation or ecosystem processes is therefore highly dependent on the geographical and temporal scale of measurement. Pollinators, herbivores, detritivores, and predators forage on available flowers, plants, dead organic matter, or prey, respectively. Suitable food items may change during the arthropod life stages and species-specific phenology results in large variation in species composition throughout the year. Pollinators are discussed in protocol 4.12 Pollinator composition.
4.11.1 What and how to measure?
There are two main strategies for quantifying macroinvertebrates: i) estimate densities per area or ii) use relative measurements based on arthropod activity (Southwood & Henderson, 2000). The distinction between these two strategies is not always clear, however, as absolute estimates are rarely obtained. Use of traps can also be further divided into passive and active trapping – passive traps catch insects by chance and active traps attract species by bait, colour, chemical lures, or light (Leather, 2004). As this protocol strives to describe methods that quantify invertebrates in climate-manipulated plots, attraction of species from larger areas is likely to include higher densities or species that are not strictly relevant to the plot. This limitation also applies to other studies focussing on local species composition. For a thorough discussion of all sampling techniques, see Southwood & Henderson (2000) and Leather (2004).
When estimating macroinvertebrates it is essential to recognise that their behaviour changes with time of day, season, weather conditions, and life stage, influencing activity and habitat use. Care should therefore be taken to minimise this variation (i.e. sample in equal conditions or preferably at the same time) when communities are compared between different sites. As there is no method that catches all macroinvertebrate groups, we will not define a gold standard, but rather describe the options related to the scale of plots and microhabitat of sampling.
Table 4.11.1. Overview of methods of macroinvertebrate sampling. Suggested plot size is noted with an x. Subplots indicate that the sampling may need to be repeated in order to represent the plot scale.
| Plot scale | |||||
| Methods | ≤ 0.25 m2 | 0.25 m2 – 1 m2 | 1 m2 – 10 m2 | ≥ 10 m2 | |
| Vegetation | Suction | x | x | subplots | subplots |
| Visual search | x | x | subplots | subplots | |
| Removal of vegetation for extraction | – | x | subplots | subplots | |
| Vegetation beating | – | – | x | x | |
| Sweep-netting | – | – | x | x | |
| Emergence traps | x | x | subplots | subplots | |
| Malaise, window, and sticky traps | – | – | – | x | |
| Fogging | – | – | – | x | |
| Soil surface | Suction | x | x | subplots | subplots |
| and litter | Visual search | x | x | subplots | subplots |
| Pitfall traps | – | x | x | subplots | |
| Removal of litter for sieving/extraction | x | x | subplots | subplots | |
| Emergence traps | x | x | subplots | subplots | |
Densities per area

In the methods described here, the sampling area is generally known and the invertebrates are estimated per unit area.
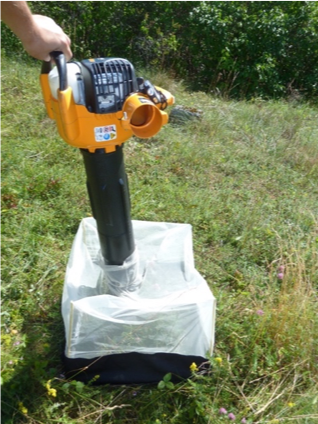
Suction or vacuum sampling has proven highly useful in grasslands and agricultural systems and is particularly efficient in sampling insects from grasses and herbs. A suction sampler (Figure 4.11.1) catches macroinvertebrates such as spiders, beetles, planthoppers, and true bugs (Brook et al., 2008; Zentane et al., 2016). It is driven by a petrol engine that sucks arthropods out of an area defined by the aperture of the sampling tube. Both wide-hosed (>20 cm in diameter) and narrow-hosed (<15 cm in diameter) types are used, but narrow-hosed types are usually most efficient and therefore recommended (Ozanne, 2004). Quadrats can be laid out and the nozzle run through the vegetation for a standard time period (e.g. 1 minute per 25 cm2; denser vegetation may require more time per unit area). A cylinder or tent with a known cross-sectional area can also be placed on the ground, the hose inserted through the top and the contents vacuumed up. This will ensure that fewer insects are being lost or being drawn into the area from the surroundings (Cherill, 2015). In one study using a 15.7 cm diameter nozzle, 16 seconds of sampling was enough to sample 90% of all beetles, spiders, planthoppers, and true bugs in grass turves covered by the nozzle compared to turf extraction and Berlese funnel techniques (Brook et al., 2008). The sampling efficiency depends on vegetation height and invertebrate groups present, as well as on the proficiency of the operator in emptying the collection bag (active insects can be lost). On the downside, a suction sampler will also suck up debris, removing more than just the macroinvertebrates from the site. Also, the method is sensitive to rain and dew, so collection should only be carried out in dry conditions. The method can be used for small to medium sized plots (Zentane et al., 2016; Facey et al., 2017; Table 4.11.1).

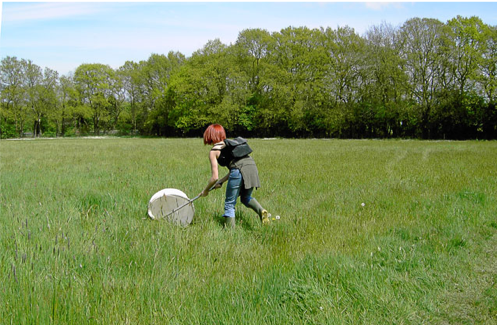
Sweep-net capture is an easily-available method shown to efficiently sample invertebrates in shrubs and low vegetation (Figure 4.11.2). The method can be standardised by a given number of sweeps per area or by length of sweeping time (e.g. 5 or 10 minutes; Ozanne, 2004). Higher vegetation complexity requires longer sweeping times or sweep numbers. The net should be moved in a figure-of-eight motion while moving forward to avoid overlap between sweeps. It has been found to be more efficient at catching larger arthropod species and less efficient with smaller species than suction sampling in coastal sage scrub, for example (Buffington & Redak, 1998). It was also demonstrated as an efficient way to catch Hymenoptera, Diptera, small Coleoptera, and arachnids in forests (Canaday, 1987). The efficiency of sweep-netting depends on the operator, with factors such as speed of net movement impacting catches, but it is also affected by vegetation structure, species composition, vertical distribution, weather conditions, and daily activity cycles of the insects sampled (pp. 267-8, Southwood & Henderson, 2000). Sweep-netting should not be carried out during wet weather. The method can be used in medium to large plots (Table 4.11.1).
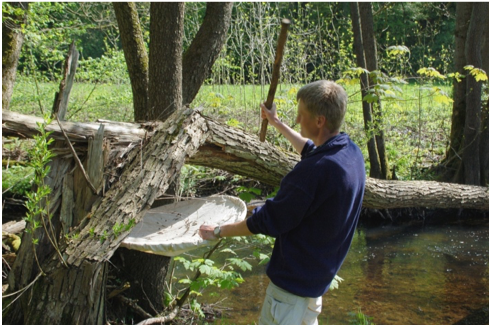
Vegetation beating is an efficient method of invertebrate sampling of shrub land or forest vegetation and might be regarded as a method of estimating densities per area or recording a relative measure (see below) depending on the species in question (Southwood & Henderson, 2000; Ozanne, 2004). It can be used on flowers, branches, twigs, or leaves and be standardised by using a defined number of similar force beats with a stout stick on a similar substrate and area. The invertebrates falling down are collected in horizontal canvas trays or an “upside down umbrella” of a standardised size and removed individually with an aspirator or soft forceps (Figure 4.11.3; Samways et al., 2009). As flying insects might escape quickly, it can be advantageous to have two people collecting from the tray. Beating was found to be the best method for collecting Hymenoptera and Coleoptera in understorey vegetation in a forest in Virginia using 10 beats and a 1 m2 sheet below the vegetation (Rohr et al., 2007). The method is dependent on dry weather and can be used in medium to large plots (Table 4.11.1). Visual search or direct counting can be used to track relatively immobile or conspicuous invertebrates on plants, such as certain butterfly larvae and adults, crickets, and snails (pp. 150-1, Southwood & Henderson, 2000). Counts of spider webs may also represent a proximate measurement of population size. Care must be taken not to disturb the animals when counting. For example, many caterpillars and aphids purposefully fall from vegetation when sufficiently disturbed as a defence reflex. The search should be carried out during a fixed time interval at a consistent time of the day, and preferably within a few days to minimise differences in population development, temperature, and moisture conditions. Depending on the animals in question, the method can be used in small to large plots. The size of animals and plot size will determine the time needed for observations (Table 4.11.1).

Removing vegetation and litter within an area with a corer and transferring it to a plastic bag followed by extraction in Berlese funnels can give a higher number of macroinvertebrates than suction sampling and could provide absolute estimates for grass turves (Brook et al., 2008; Zentane et al., 2016). Removed litter may also be hand sorted or sieved before extraction. When electricity is unavailable, a Winkler bag can be used, which works on the same principle as a Berlese funnel, but without heat (Samways et al., 2009). Removal of vegetation and litter are highly destructive to the plots, but may potentially work at all scales by sampling several subsets of the plots (Table 4.11.1). Dead wood structures may also be broken open and inspected and the remaining invertebrates extracted or placed in emergence traps (see below).
Emergence traps can be used to estimate insects in pieces of dead wood, fungi, litter, soil, and vegetation (Samways et al., 2009). The material is enclosed in a dark net or box with a mounted collection tube to which the insects are attracted by light. Ground emergence traps, i.e. a floorless black tent mounted on the ground with a collection tube in an upper corner, can be efficient for estimating densities of ground-living flies and nesting solitary bees as well as for dating their emergence. Emergence traps can catch insects present as larvae or pupae at the time of mounting if left for a longer time period. Parasitoids can be efficiently captured when emerging from particular substrates. The traps can be deployed in the field or transferred to the lab. When mounted on the ground, the vegetation can be affected by the trap, and removal of material will obviously disturb plots. Depending on material enclosed in the trap, this trap type can be applied to plots of all sizes (Table 4.11.1). However, the size and number of traps needed is highly dependent on the density of insects in the study area. When numbers are particularly low, such as in the High Arctic, they are likely to be inefficient.
Relative measures
In the methods described above, the relative abundance of invertebrates is estimated per unit area. With the trapping devices described below, the sampling area is generally unknown as the species composition and abundances depend on invertebrates actively entering the trap. Thus, when interpreting the data, differences in numbers of the same species should be considered.

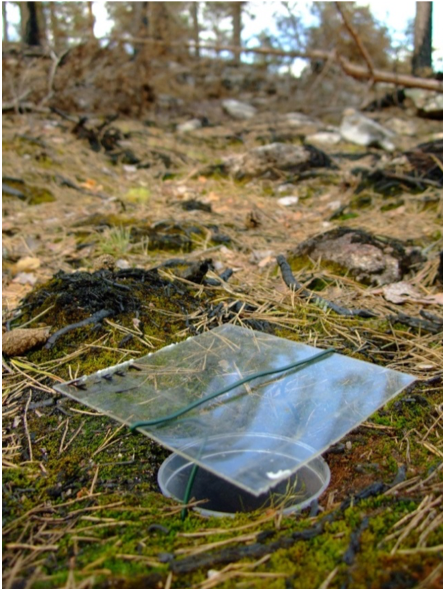
Pitfall traps catch active, mainly polyphagous predators, foraging on the soil surface. The major taxonomic groups caught are ants, wandering spiders (Aranae: Lycosidae, Clubionidae), rove beetles (Coleoptera: Staphylinidae), and ground beetles (Coleoptera: Carabidae) (Southwood & Henderson, 2000; Woodcock, 2004). In polar areas where several insect groups tend to stay close to the soil surface, pitfall trapping has also been used to compare catches of butterflies, midges, and flies (Høye et al., 2013). Pitfall trapping is one of the oldest and most-used techniques and a large number of studies have focused on trapping efficiency relative to trap construction and placement (Woodcock, 2004). Generally, a pitfall trap (Figure 4.11.4) consists of a jar dug into the ground so that the rim is level with the soil surface and half filled with some sort of liquid preservative (saline solution or propylene glycol are the least attractive to animals and have low toxicity, to which a few drops of detergent is added to break the surface tension). An upper jar diameter of 6–9 cm and a 6–7 cm depth works well. A roof, 3–4 cm above the trap entrance, prevents overflowing during rain and dilution of preservative as well as blocking debris which could create insect escape routes from falling in.
Use of a transparent roof minimises the influence of roofs on trap catches (Woodcock, 2004). Trapping periods depend on the rate of preservative evaporation (heat) and dilution (rain), number of animals caught (traps can fill up), and the research question, but generally range from 2 days in the tropics to a maximum of 4 weeks in colder areas. Use of two layers of traps, with only the inner trap removed during each emptying session, ensures minimal soil disturbance. The trap catches depend on the vegetation structure immediately surrounding the traps and, if comparing sites with highly different structure, removing vegetation immediately around the trap should be considered (Woodcock, 2004). Digging pitfall traps is destructive to plots and affects trap catches for a few days after installation. Pitfall traps can work on small to large plot sizes (Table 4.11.1).
Malaise traps, sticky traps, pan traps, and interception traps are all ways to target flying insects and their effective use depends on flight activity. As most climate-manipulation plots are relatively small (<10 m2), flight-based insects traps are likely to catch insects from a much larger area or those merely passing by, and thus introduce too much noise for plot-related effects. However, they might be good for baseline data backing up plot-level studies, gradient studies, or studies of changes through time, and a short description is therefore given. Malaise traps are tent-like structures attached to the ground and measuring up to 2 m high. A traditional malaise trap consists of a fine mesh net intercepting flight in two directions and a roof leading the insects into a sampling jar with preservative. They come in several sizes and colours, each affecting trap catches (bicoloured is the most used). A standard Townes-type trap usually needs about 2 m2 for proper mounting. Small and mostly flying invertebrates such as diptera (herbivores, detritivores, predators) and hymenoptera (herbivores, parasitoids) are particularly well sampled. Malaise traps work in damp conditions and may therefore be used as an alternative to suction sampling or sweep-netting if the understorey is constantly wet (Ozanne, 2004). Sticky traps catch flying insects such as pollinators, herbivores, or their parasitoids and predators, and have been used in Free Air CO2 Enrichment (FACE) studies (Facey et al., 2017) and studies of parasitoid communities on herbivores (http://www.helsinki.fi/foodwebs/parasitoids/). The catch depends on trap colour, height, and position (vertical, angled, horizontal) (Young, 2005). Interception traps (window traps) are traps undetected by flying insects and are most commonly used to catch beetles, but bees and other flying insects are also captured. Fully transparent material, often Perspex or acrylic, are used either in a cross shape or single panel and when a flying insect hits the trap, it falls down into a collecting bottle or tray with preservative and detergent (see pitfall traps above). Malaise traps, sticky traps, and window traps can be placed close to objects (trees, shrubs, dead wood) to increase the focus of the trap catches. For traps targeting pollinating insects such as pan traps, see protocol 4.12 Pollinator composition.
Where to start
Leather (2004), Samways et al. (2009), Southwood & Henderson (2000)
4.11.2 Special cases, emerging issues, and challenges
The use of image-based observations for estimating animals and plants is an emerging and highly interesting method (Burton et al., 2015; Steenweg et al., 2017). Combined with effective image-analysis, this has a large potential for future species monitoring at least of the larger and easily identified macroinvertebrates. The use of environmental DNA (eDNA), that is sampling of DNA from the environment, also has a high potential for identification and monitoring of elusive and small species such as invertebrates (Bohmann et al., 2014). Invertebrates might also be pulverised and identified by DNA-barcoding. This can be time-efficient as compared with sorting and visual identification. To ensure the best material for barcoding, the macroinvertebrates should preferably be stored in 96% ethanol.
We have not included canopy invertebrates in this protocol as they are outside the usual plot size for climate manipulation experiments. To sample these structures, traps (for example interception traps or sticky traps) could be mounted hanging from branches. If the canopy is very high, walkways, cranes, drones or other devices might be needed to access the area. Chemical knockdown can be used from the ground. Fogging or misting include insecticides (natural pyrethrum or synthetic pyrethroids, the first is most quickly broken down by UV-radiation) and can only be carried out under calm and dry conditions. The macroinvertebrates are collected at the ground, or higher up, by collection mats or trays. For more information about canopy sampling, see Ozanne (2014) and Samways et al. (2009).
4.11.3 References
Theory, significance, and large datasets
Leather (2004), Samways et al. (2009), Southwood & Henderson (2000)
More on methods and existing protocols
Facey et al. (2017), Leather (2004), Samways et al. (2009), Southwood and Henderson (2000)
All references
Bohmann, K., Evans, A., Gilbert, M. T. P., Carvalho, G. R., Creer, S., Knapp, M., … de Bruyn, M. (2014). Environmental DNA for wildlife biology and biodiversity monitoring. Trends in Ecology & Evolution, 29(6), 358-367.
Brook, A. J., Woodcock, B. A., Sinka, M., & Vanbergen, A. J. (2008). Experimental verification of suction sampler capture efficiency in grasslands of differing vegetation height and structure. Journal of Applied Ecology, 45(5), 1357-1363.
Buffington, M. L., & Redak, R. A. (1998). A comparison of vacuum sampling versus sweep-netting for arthropod biodiversity measurements in California coastal sage scrub. Journal of Insect Conservation, 2(2), 99-106.
Burton, A. C., Neilson, E., Moreira, D., Ladle, A., Steenweg, R., Fisher, J. T., … Boutin, S. (2015). Wildlife camera trapping: a review and recommendations for linking surveys to ecological processes. Journal of Applied Ecology, 52(3), 675-685.
Canaday, C. L. (1987). Comparison of insect fauna captured in six different trap types in a Douglas-fir forest. The Canadian Entomologist, 119(12), 1101-1108.
Cherill, A. (2015). Suction sampling of grassland invertebrates using the G-vac: Quantifying and avoiding peripheral suction effects. European Journal of Entomology, 112(3), 520-524.
Facey, S. L., Fidler, D. B., Rowe, R. C., Bromfield, L. M., Nooten, S. S., Staley, J. T., … Johnson, S. N. (2017). Atmospheric change causes declines in woodland arthropods and impacts specific trophic groups. Agricultural and Forest Entomology, 19(1), 101-112.
Høye, T. T., Post, E., Schmidt, N. M., Trøjelsgaard, K., & Forchhammer, M. C. (2013). Shorter flowering seasons and declining abundance of flower visitors in a warmer Arctic. Nature Climate Change, 3, 759.
Leather, S. R. (Ed.) (2004). Insect Sampling in Forest Ecosystems. Oxford: Wiley-Blackwell.
Ozanne, C. M. P. (2004). Sampling methods for forest understory vegetation. In S. R. Leather (Ed.), Insect Sampling in Forest Ecosystems (pp. 58-76). Oxford: Wiley-Blackwell.
Rohr, J. R., Mahan, C. G., & Kim, K. C. (2007). Developing a monitoring program for invertebrates: guidelines and a case study. Conservation Biology, 21(2), 422-433.
Samways, M. J., McGeoch, M. A., & New, T. R. (2009). Insect Conservation. A Handbook of Approaches and Methods. Oxford: Oxford University Press.
Southwood, T. R. E., & Henderson, P. A. (2000). Ecological Methods (3rd ed.). Oxford: Blackwell.
Steenweg, R., Hebblewhite, M., Kays, R., Ahumada, J., Fisher, J. T., Burton, C., … Rich, L. N. (2017). Scaling-up camera traps: monitoring the planet’s biodiversity with networks of remote sensors. Frontiers in Ecology and the Environment, 15(1), 26-34.
Woodcock, B. A. (2004). Pitfall trapping in ecological studies. In S. R. Leather (Ed.), Insect Sampling in Forest Ecosystems (pp. 37-57). Oxford: Wiley-Blackwell.
Young, M. (2005). Insects in flight. In S. R. Leather (Ed.), Insect Sampling in Forest Ecosystems (pp. 116-145). Oxford: Wiley-Blackwell.
Zentane, E., Quenu, H., Graham, R. I., & Cherrill, A. (2016). Suction samplers for grassland invertebrates: comparison of numbers caught using Vortis™ and G-vac devices. Insect Conservation and Diversity, 9(5), 470-474.
Author: Birkemoe T1
Reviewers: Sverdrup-Thygeson A1, Gillespie MAK2, 3, Eycott AE4,5
Affiliations
1 Faculty of Environmental Sciences and Natural Resource Management, University of Life Sciences, Ås, Norway
2 Department of Arctic and Marine Biology, Faculty of Biosciences, Fisheries and Economics, UiT—The Arctic University of Norway, Tromsø, Norway
3 Department of Engineering & Natural Sciences, Sogn & Fjordane University College, Sogndal, Norway
4 Faculty of Biosciences and Aquaculture, Nord University, Steinkjer, Norway
5 Department of Biological Sciences, University of Bergen, Bergen, Norway