Authors: McDowell NG1, Hoch G2, Landhäusser SM3
Reviewer: Dickman LT4
Measurement unit: percent dry weight; Measurement scale: grinding unit, spectrophotometer, water bath, etc.; Equipment costs: €€€; Running costs: €; Installation effort: medium; Maintenance effort: medium; Knowledge need: medium; Measurement mode: manual
Non-structural carbohydrates (NSCs) provide the energy to sustain growth, reproduction, metabolism, and survival in plants (Chapin et al., 1990). NSC concentrations measured and scaled appropriately provide insight into carbon allocation, storage, and utilisation patterns (Dietze et al., 2014; Martinez-Vilalta et al., 2016). NSCs are simple sugars including glucose, fructose, and sucrose, as well as oligo- and polysaccharides such as starch. Lipids, while not carbohydrates, are another important energy source in some plants (Hoch & Körner, 2003; Hoch et al., 2003). NSC concentrations in plants are sensitive to water availability (Würth et al., 2005; Dickman et al., 2015), CO2 (Bader et al., 2013; Hartmann et al., 2013; Quirk et al., 2013), soil and air temperature (Hoch & Körner, 2012; Karst & Landhäusser, 2014), growth rates (Sulpice et al., 2009; Hummel et al., 2010), injury (Landhäusser & Lieffers, 2012; Wiley et al., 2016), regeneration (Landhäusser & Lieffers, 2002; Paula & Ojeda, 2009), shade (Marshall, 1986; Weber et al. 2019), nutrients (Linder, 1995), and season (Ericsson & Persson, 1980). NSC availability has also been implicated in maintenance and repair of xylem hydraulic conductivity (McDowell et al., 2011; O’Brien et al., 2014; Trifiliò et al. 2019). NSC measurement and understanding of function has expanded significantly in the last decade to address both crop and wildland questions, driven in particular by climate change and other global changes and associated pressures on plant growth, yield, and survival.
5.3.1 What and how to measure?
Measurement principles and challenges
To measure NSC a plant tissue sample is ground and the sugars and starch molecules extracted, refined, and finally quantified by either spectrometry or chromatography. Many methods have been used for the collection, preparation, and analysis of NSC samples. Unfortunately, comparison across 29 international laboratories revealed that this variety of methods results in a wide range of NSC concentrations reported for the same samples, presenting a challenge for inter-lab comparisons (Quentin et al., 2015). Luckily, most published studies on NSCs include samples processed only at one lab, allowing valid within-study comparisons of NSCs (e.g. among experimental treatments). There are no accepted reference standards for NSC: particularly not any that are appropriate for plant tissues with complex matrices. Because no method has yet been determined to be the most accurate, in this chapter we present a “reference” method building on the results of Quentin et al. (2015) and Landhäusser et al. (2018) who suggested some approaches to reduce variability across laboratories. Rather than re-state all of the methods as presented in Quentin et al. (2015) and Landhäusser et al. (2018), we have focused on identifying the sources of variability amongst methods so that scientists may minimise errors and maximise reproducibility of NSC results within and across laboratories.
The main sources of variability in the field are 1) inconsistency in sample collection (e.g. dissimilar tissues, organ size (such as roots or twigs of different diameter, and timing of collection), and 2) subsequent handling of samples (e.g. field storage, lab preparation). In the laboratory, the main sources of variability lie in 1) the precision and execution of basic laboratory procedures (e.g. preparation of chemical solutions and dilutions, inconsistencies in pipetting and weighing), 2) the failure to use internal standards and calibrations with every analytical run, and 3) calculation errors. When starting a new experiment or laboratory studying NSCs, we suggest these are the most critical focal areas to develop because they are the major sources of variation that impede reproducibility and comparability within and among laboratories.
Sample collection, preparation, and analysis
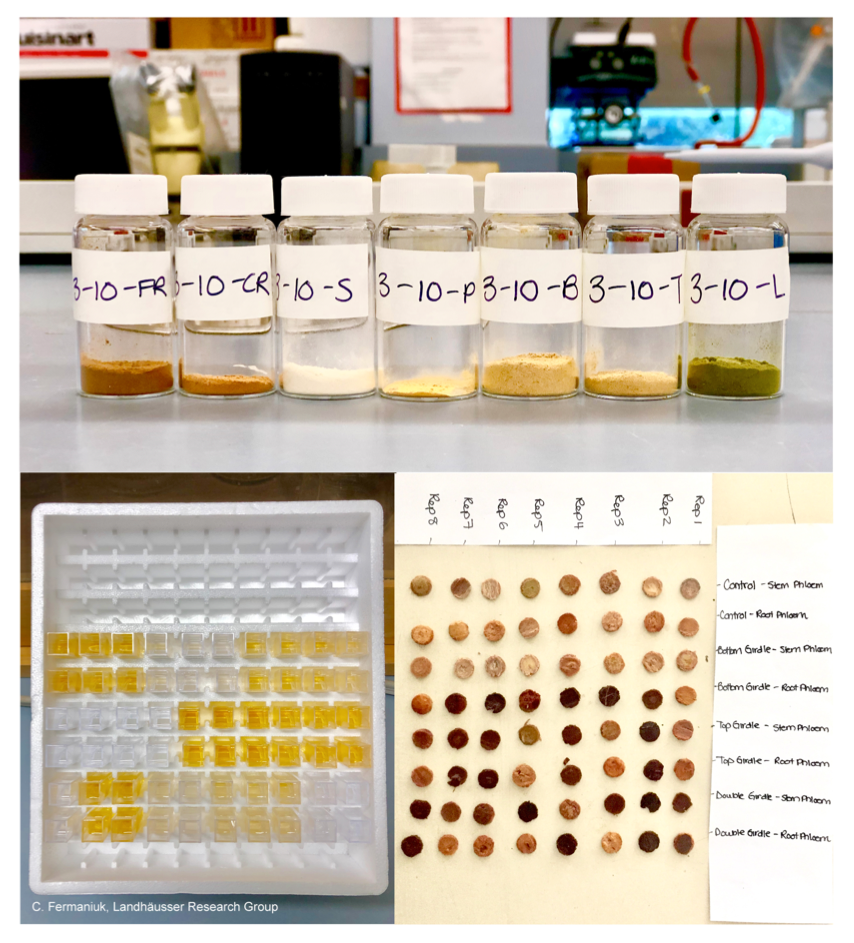
Fundamentally, the process of determining NSCs starts with sample collection, proceeds through preparation, including grinding of samples into powder, and ends with analysis (Figure 5.3.1). To compare NSC among experimental treatments it can be important to collect samples at the same time of day, as NSCs can vary over a 24-hour period (Landhäusser, 2011). Likewise, plant organs differ substantially in their NSC concentrations depending on the species and its phenological condition (e.g. Würth et al., 2005; Landhäusser & Lieffers, 2003; Dickman et al., 2015; Martinez-Vilalta et al., 2016), thus wise selection, timing, and consistent sampling are essential. For example, if NSC pools in plants are compared across different locations, it is imperative to confirm that the sampled plants are at the same phenological and developmental stage in all locations. This is especially important if plants are sampled across elevational transects (Hoch, 2015). In boreal conifers there is a pronounced seasonal variation in foliar starch reserves (e.g. Ericsson & Persson, 1980; Linder, 1995) which must be considered when estimating concentrations of other foliar elements. Finally, it should be taken into account that NSC concentrations can vary significantly even for the same tissue type within a single plant individual, for example along a light gradient within a tree canopy, or within tree stems from the youngest to the oldest wood fraction. It is therefore valuable to consistently sample within the same light environment and age class, or to sample across ages and conditions to produce an “average” value.
Another potentially critical step in sample collection is to ensure that enzymatic activity that can metabolise NSCs is halted after sampling so that measured concentrations represent the condition of the plant at the time of sampling and are not influenced by sample degradation after collection. This can be done by rapidly freezing the sample in dry ice or liquid nitrogen, followed soon after by microwaving or freeze drying. Currently it is unknown how long samples can sit between sampling and the cessation of enzymatic activity without influencing the results. Maintaining dry samples until further processing is therefore essential.
Grinding of material is typically done with a ball-mill. The critical step in creating powdered samples is to grind the material to < 0.15 mm particle size to allow for complete extraction and solubilisation of NSCs (Quentin et al., 2015). Dried and powdered samples are stored dry over desiccant and should be re-dried immediately before weighing, along with internal laboratory standards and blanks to allow for internal calibration and procedural checking.
Chemical analysis
All methods described here first extract the water or ethanol-soluble sugars and then analyse starch from the pellet after degradation to glucose-units. The steps following sample preparation include extraction of NSCs and separation into soluble sugars (supernatant after centrifugation) and starch (contained in the insoluble tissue pellet), followed by spectrophotometric or HPLC measurement of the soluble sugars.
For the quantification of soluble sugars, three general approaches are commonly used: (1) colorimetric-photometric (Dubois et al., 1956; Ashwell, 1957; Miller, 1959; Buysse & Merckx, 1993; Chow & Landhäusser, 2004); (2) enzymatic-photometric (Wong, 1990; Hoch et al., 2003; Sevanto et al., 2014); and (3) chromatographic (Raessler et al., 2010). Approaches (1) and (2) have the advantage of being fast and relatively economical methods, but approach (1) does not distinguish between the low molecular weight sugars (i.e. mono- and oligosaccharides are lumped together), while approach (2) can quantify individual sugars of interest in an aqueous solution through a series of enzyme-catalysed reactions, but is complicated by issues of enzyme specificity and the need to adjust enzyme concentrations with each new sample type. Approach (3) has the advantage of allowing all low molecular weight sugars to be quantified separately, and chromatographic analyses are more sensitive. However, approach (3) requires more time-intensive analyses (i.e. lower sample throughput) and is more expensive. The greatest challenge with all three approaches is to quantitatively extract all sugars without extracting structural carbon compounds (e.g. hemicellulose).
a) Sugar extraction
For the extraction of low molecular weight sugars, one should preferentially use ethanol (Landhäusser et al. 2018). Water extraction cannot be recommended as starch gelatinises in water, which reduces the amount of starch in the pellet and underestimates starch concentrations. If water extraction is necessary, two separate samples must be run: one for soluble sugar analyses and one for total NSC analyses (i.e. soluble sugar and starch analysis combined) and then subtract the soluble sugar concentration (sample 1) from the total concentration (sample 2) to calculate the starch concentration of the sample.
b) Starch degradation
To estimate starch in tissue samples, most methods convert the starch polymer to glucose hydrolysate, which is subsequently assayed. A crucial issue is the exhaustive degradation of starch in plant tissue, since an incomplete hydrolysation of starch will lead to an underestimation of the real starch concentration. In contrast, the actual starch concentration will be overestimated if methods are used that also degrade glucose from polymers other than starch. Acid hydrolysis using sulphuric or hydrochloric acid is considered the simplest and most rapid method to hydrolyse starch and is often found in the NSC literature. This approach has been found to be inaccurate as it can digest structural components (e.g. cellulose and hemicelluloses, which also contain glucose units) in the tissue even at low acid concentrations (Marshall, 1986; Chow & Landhäusser, 2004). Therefore we believe that the most reliable method to determine starch concentrations is an enzymatic degradation. We suggest using a stepwise degradation with amylase and then amyloglucosidase. It is important to apply enzymes in surplus to ensure complete degradation of starch to glucose, and to use the enzymes in sequence (amylase first) since amyloglucosidase is not specific to starch and will degrade additional malto-oligosaccharides if applied before amylase. It is also essential to maintain consistent conditions for enzymatic degradation across samples (e.g. time and temperature).
c) Calculations
NSC is calculated as the sum of all measured low molecular sugars determined by the respective methods plus starch. With the hydrolysis of starch, each glucose-unit accepts one H2O molecule. Hence, when calculating the amount of starch within a sample, the amount of starch-derived glucose after degradation has to be corrected by subtracting the mass of this H2O from the molar mass of glucose (i.e. 180 g per mol (Glc) – 18 g per mol (H2O) = 162 g per mol). Thus, the measured mass of glucose derived from the starch contained in the sample has to be reduced by 10%. More detailed descriptions of calculations based on the different quantification methods are provided in Landhäusser et al. (2018).
d) A note on units
Commonly, the NSC content of plant tissue is presented as a concentration relative to the total dry matter (either as mg g-1 or as % dry matter). It is important to note that these concentrations are not only dependent on the numerator (i.e. the amount of NSC), but also on the denominator (i.e. the total dry mass), which is largely driven by the amount of cell wall compounds in plant tissue. Hence, special attention must be paid in situations where NSC is compared from samples with different cell wall fractions (e.g. leaves with different specific leaf area, or wood samples with different wood densities). In such cases, it is advisable to report NSC concentrations on a volume basis (mg cm-3; e.g. see Hoch, 2008).
Where to start
Chapin et al. (1990), Landhäusser et al. (2018), Martinez-Vilalta et al. (2016), Quentin et al. (2015)
5.3.2 Special cases, emerging issues, and challenges
Alternative approaches
An alternative approach to the wet chemical quantification of NSC in plant tissue might be the use of near-infrared spectrometry (NIRS) on bulk plant powder. Previous attempts to quantify NSC in different tissue types showed promising results (Decruyenaere et al., 2012; Ramirez et al., 2015; Quentin et al., 2016). However, NIRS analyses of NSC require separate calibrations with wet chemical methods for each tissue type. Therefore, this method is mainly applicable for investigations of large numbers of samples from the same tissue type.
Next steps towards standard procedures for NSC quantification
Until recently there were no unified standard procedures for sample collection, handling, NSC extraction, or starch digestion that could be used by scientists (Smith & Zeeman, 2006). However Landhäusser et al. (2018) provide very detailed step-by-step procedures and protocols for the three soluble sugar quantification methods and enzymatic starch quantification described earlier, which should help reduce inconsistencies in laboratory procedures that have been responsible for the large variability and erroneous results. There are currently no universal and international NSC sample standards for plant material with precisely known starch and sugar concentrations. To improve comparability of NSC among different laboratories, international plant standards for NSC are highly desirable.
5.3.3 References
Theory, significance, and large datasets
Chapin et al. (1990), Landhäusser et al. (2018), Martinez-Vilalta et al. (2016), McDowell (2011), Quentin et al. (2015)
More on methods and existing protocols
Chow & Landhäusser (2004), Dickman et al. (2015), Hoch et al. (2003), Landhäusser et al. (2018), Raessler et al. (2010)
All references
Ashwell, G. (1957). Colorimetric analysis of sugars. Methods in Enzymology, 3, 73-105.
Bader, M. K. F., Leuzinger, S., Keel, S. G., Siegwolf, R. T. W., Hagedorn, F., Schleppi, P., & Körner, C. (2013). Central European hardwood trees in a high-CO2 future: synthesis of an 8-year forest canopy CO2 enrichment project. Journal of Ecology, 101, 1509-1519.
Buysse, J. & Merckx, R. (1993). An improved colorimetric method to quantify sugar content of plant tissue. Journal of Experimental Botany, 44, 1627-1629.
Chapin, F. S., Schulze, E. D., & Mooney H. A. (1990). The ecology and economics of storage in plants. Annual Review of Ecology and Systematics, 21(1), 423-447.
Chow, P. S., & Landhäusser, S. M. (2004). A simplified method for measuring sugar and starch content in woody-plant tissues. Tree Physiology, 24, 1129-1136.
Decruyenaere, V., Clėment, C., Agneesens, R., Losseau, C., & Stilmant, D. (2012). Development of near-infrared spectroscopy calibrations to quantify starch and soluble sugar content in the roots of Rumex obtusifolius. Weed Research, 52(1), 1-5.
Dickman, L. T., McDowell, N. G., Sevanto, S., Pangle, R. E., Pockman, W. T. (2015). Carbohydrate dynamics and mortality in a piñon‐juniper woodland under three future precipitation scenarios. Plant, Cell & Environment, 38(4), 729-739.
Dietze, M. C., Sala, A., Carbone, M. S., Czimczik, C. I., Mantooth, J. A., Richardson, A. D., & Vargas, R. (2014). Nonstructural carbon in woody plants. Annual Review of Plant Biology, 29(65), 667-687.
Dubois, M., Gilles, K. A., Hamilton, J. K., Rebers, P. A., & Smith, F. (1956). Colorimetric method for determination of sugars and related substances. Analytical Chemistry, 28, 350-356.
Ericsson, A., & Persson, H. (1980). Seasonal changes in starch reserves and growth of fine roots of 20-year-old scots pines. Ecological Bulletins, 32, 239-250.
Hartmann, H., Ziegler, W., Kolle, O., & Trumbore, S. (2013). Thirst beats hunger – declining hydration during drought prevents carbon starvation in Norway spruce saplings. New Phytologist, 200, 340-349.
Hoch, G. (2008). The carbon supply of Picea abies trees at a Swiss montane permafrost site. Plant Ecology & Diversity, 1, 13-20.
Hoch, G. (2015) Carbon reserves as indicators for carbon limitation in trees. In U. Lüttge, & W. Beyschlag (Eds.), Progress in Botany (pp. 321-346). Cham: Springer.
Hoch, G., & Körner, C. (2003). The carbon charging of pines at the climatic treeline: a globalcomparison. Oecologia, 135, 10-21.
Hoch, G., & Körner, C. (2012). Global patterns of mobile carbon stores in trees at the high‐elevation tree line. Global Ecology and Biogeography, 21, 861-871.
Hoch, G., Richter, A., & Körner, C. (2003). Non-structural carbon compounds in temperate forest trees. Plant, Cell & Environment, 26, 1067-1081.
Hummel, I., Pantin, F., Sulpice, R., Piques, M., Rolland, G., Dauzat, M., … Gibon, Y. (2010). Arabidopsis plants acclimate to water deficit at low cost through changes of carbon usage: an integrated perspective using growth, metabolite, enzyme, and gene expression analysis. Plant Physiology, 154(1), 357-372.
Karst, J., & Landhäusser, S. M. (2014). Low soil temperatures increase carbon reserves in Picea mariana and Pinus contorta. Annals of Forest Science, 71, 371-380.
Landhäusser, S. M. (2011). Aspen shoots are carbon autonomous during bud break. Trees, 25, 531-536.
Landhäusser, S. M., & Lieffers, V. J. (2002). Leaf area renewal, root retention and carbohydrate reserves in a clonal tree species following aboveground disturbance. Journal of Ecology, 90, 658-665.
Landhäusser, S. M., & Lieffers, V. J. (2003). Seasonal changes in carbohydrate reserves in mature northern Populus tremuloides clones. Trees, 17, 471-476
Landhäusser, S. M., & Lieffers, V. J. (2012). Defoliation increases risk of carbon starvation in root systems of mature aspen. Trees, 26, 653-661.
Landhäusser, S. M., Chow, P. S., Dickman, L. T., Furze M., Kuhlman, I., Schmid S., … Adams, H. D (2018). Standardized protocols and procedures can precisely and accurately quantify non-structural carbohydrates. Tree Physiology , 38, 1764-1778.
Linder, S. (1995). Foliar analysis for detecting and correcting nutrient imbalances in Norway spruce. Ecological Bulletins(Copenhagen), 44, 178-190.
Marshall, J. D. (1986). Drought and shade interact to cause fine-root mortality in Douglas-fir seedlings. Plant and Soil, 91, 51-60.
Martinez-Vilalta, J., Sala, A., Asensio, D., Galiano, L., Hoch, G., … Lloret, F. (2016). Dynamics of non-structural carbohydrates in terrestrial plants: a global synthesis. Ecological Monographs, 86, 495-516.
McDowell, N.G. (2011). Mechanisms linking drought, hydraulics, carbon metabolism, and vegetation mortality. Plant Physiology, 155(3), 1051-1059.
McDowell, N. G., Beerling, D. J., Breshears, D. D., Fisher, R. A., Raffa, K. F., & Stitt, M. (2011). The interdependence of mechanisms underlying climate-driven vegetation mortality. Trends in Ecology & Evolution, 26(10), 523-532.
Miller, G. L. (1959). Use of dinitrosalicylic acid reagent for determination of reducing sugar. Analytical Chemistry, 31(3), 426-428.
O’Brien, M. J., Leuzinger, S., Philipson, C. D., Tay, J., & Hector, A. (2014). Drought survival of tropical tree seedlings enhanced by non-structural carbohydrate levels. Nature Climate Change, 4(8), 710-714.
Paula, S., & Ojeda, F. (2009). Belowground starch consumption after recurrent severe disturbance in three resprouter species of the genus Erica. Botany, 87, 253-259.
Quentin, A. G., Pinkard, E. A., Ryan, M. G., Tissue, D. T., Baggett, L. S., Adams, H. D., … Woodruff, D. R. (2015). Non-structural carbohydrates in woody plants compared among laboratories. Tree Physiology, 35(11), 1146-1165.
Quentin, A. G., Rodemann, T., Doutreleau, M.-F., Moreau, M., Davies, N. W., & Millard, P. (2016). Application of near-infrared spectroscopy for estimation of non-structural carbohydrates in foliar samples of Eucalyptus globulus Labilladière. Tree Physiology, 37(1), 131-141.
Quirk, J., McDowell, N. G., Leake, J. R., Hudson, P. J., & Beerling, D. J. (2013). Increased susceptibility to drought-induced mortality in Sequoia sempervirens (Cupressaceae) trees under Cenozoic atmospheric carbon dioxide starvation. American Journal of Botany, 100(3), 582-591.
Raessler, M., Wissuwa, B., Breul, A., Unger, W., & Grimm, T. (2010). Chromatographic analysis of major non-structural carbohydrates in several wood species – an analytical approach for higher accuracy of data. Analytical Methods, 2, 532-538.
Ramirez, J. A., Posada, J. M., Handa, I. T., Hoch, G., Vohland, M., Messier, C., & Reu, B. (2015). Near-infrared spectroscopy (NIRS) predicts non-structural carbohydrate concentrations in different tissue types of a broad range of tree species. Methods in Ecology and Evolution, 6, 1018-1025.
Sevanto, S., McDowell, N. G., Dickman, L. T., Pangle, R., Pockman, W. T. (2014). How do trees die? A test of the hydraulic Failure and carbon starvation hypotheses. Plant, Cell & Environment, 37, 153-161.
Smith, A. M. & Zeeman, S. C. (2006). Quantification of starch in plant tissues. Nature Protocols, 1, 1342-1345.
Sulpice, R., Pyl, E. T., Ishihara, H., Trenkamp, S., Steinfath, M., Witucka-Wall, H., … Stitt, M. (2009). Starch as a major integrator in the regulation of plant growth. Proceedings of the National Academy of Sciences USA, 106(25), 10348-10353.
Trifilò, P., Kiorapostolou, N., Petruzzellis, F., Vitti, S., Petit, G., Lo Gullo, M. A., … Casolo, V. (2019). Hydraulic recovery from xylem embolism in excised branches of twelve woody species: relationships with parenchyma cells and non-structural carbohydrates. Plant Physiology and Biochemistry, 139, 513-520.
Weber, R., Gessler, A., & Hoch G. (2019). High carbon storage in carbon-limited trees. New Phytologist, 222(1), 171-182.
Wiley, E., Rogers, B. J., Hodgkinson, R., & Landhäusser, S. M. (2016). Nonstructural carbohydrate dynamics of lodgepole pine dying from mountain pine beetle attack. New Phytologist, 209, 550-562.
Wong, S. C. (1990). Elevated atmospheric partial-pressure of CO2 and plant-growth. 2 – Nonstructural carbohydrate content in cotton plants and its effect on growth-parameters. Photosynthesis Research, 23, 171-180.
Würth, M. K., Pelaez-Riedl, S., Wright, S. J., & Körner, C. (2005). Non-structural carbohydrate pools in a tropical forest. Oecologia, 143(1), 11-24.
Authors: McDowell NG1, Hoch G2, Landhäusser SM3
Reviewer: Dickman LT4
Affiliations
1 Pacific Northwest National Laboratory, Richland Washington, USA
2 Department of Environmental Sciences – Botany, University of Basel, Basel, Switzerland
3 Department of Renewable Resources, University of Alberta, Edmonton, Canada
4 Earth and Environmental Sciences Division, Los Alamos National Laboratory, Los Alamos, USA