Authors: Mänd P1, Stuart-Haëntjens E2, Marshall J3
Reviewers: Gough C2, Zinnert J C2
Measurement unit: μmol CO2 m-2 s-1; Measurement scale: leaf; Equipment costs: €€€; Running costs: €€; Installation effort: medium; Maintenance effort: medium; Knowledge need: high; Measurement mode: manual or automated
Through the process of photosynthesis (carbon dioxide assimilation, A), plants fix carbon dioxide (CO2) from the atmosphere and release oxygen (O2), harnessing light energy to produce stored chemical energy. This chemical energy is stored in carbohydrate molecules, such as sugars and starch, which are synthesised from CO2 and water (H2O). Measurements of photosynthesis are necessary to understand the mechanisms, magnitude, and dynamics of leaf-level carbon fixation and its relationship to plant biomass accumulation (i.e., net primary production) (Geider et al., 2001). Quantitative understanding of species- and functional-group specific relationships between the dynamic environmental drivers of photosynthetic capacity informs predictions – especially via simulation modelling – of leaf- to ecosystem-scale carbon sequestration as climate changes (Taiz & Zeiger, 2010; Kodama et al., 2011; Ashraf & Harris, 2013; Atkin, 2015). Rates of photosynthesis are sensitive to the quantity of light absorbed by chlorophyll, air temperature, soil water availability, humidity, elevated atmospheric CO2, and soil conditions including nutrient availability (Kirschbaum, 2004). In addition to climatic drivers, other global-change drivers such as pollution in the form of ozone and SO2 (Heber et al., 1995), fertilisation and nitrogen deposition (Evans & Clarke, 2018), and fire (Yue & Unger, 2018) influence leaf-scale photosynthesis. The methods described here can be applied to study the responses of leaf photosynthetic performance to all these different drivers. There are different approaches available for estimating photosynthesis, depending on the temporal and spatial scale of interest (Hunt, 2003; Barbour et al., 2007; Millan-Almaraz et al., 2009). The upscaling of leaf-level photosynthesis to ecosystem level is dealt with in protocol 2.3.3 Upscaling from the plot scale to the ecosystem and beyond. Most commonly, leaf-level photosynthetic parameters are measured using non-destructive, commercially available gas-exchange systems, many of which allow the operator to manipulate the environmental conditions of the leaf cuvette.
2.1.3.1 What and how to measure?
Gold standard
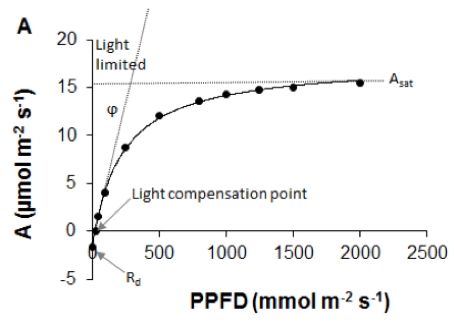
Carbon dioxide assimilation (A) is most commonly measured on intact leaves using a portable gas-exchange system with a climate-controlled cuvette in which light intensity, CO2 concentration, temperature, and humidity are precisely regulated (Farquhar et al., 1980; von Caemmerer & Farquhar, 1981; Long et al., 1996; Long & Bernacchi, 2003). Leaf-level light-response curves – constructed through measurements of A at a series of light levels – provide information on several components of gas exchange, such as dark respiration rate (Rd), light compensation point, quantum efficiency (ϕ), and light saturated photosynthetic rate (Asat; Figure 2.1.3.1A; Ögren & Evans, 1993; Lobo et al., 2013). Photosynthetically active radiation (PAR) is the main limiting factor for A at low light intensities, while at higher light intensities other factors, such as CO2 uptake are more limiting to A (Ögren & Evans, 1993). However, full light-response curves are time consuming. It requires up to 15–20 min measuring time at each light intensity (or 5 min per curve for rapid light response curves, although this leaves no time for stomatal adjustment; but see Special cases, emerging issues and challenges). The photosynthetic rate under light-saturating conditions (Asat) is commonly used to rapidly evaluate photosynthetic capacity. The methodological aspects of measuring light-saturated photosynthetic rate are summarised in Pérez-Harguindeguy et al. (2013), where the term Amax is used instead. We note that Amax, Asat, and light saturated Anet are often used synonymously to indicate light-saturated photosynthetic rate. However, Jarvis & Davies (1998) defined the maximum rate of photosynthesis, Amax, as Asat when CO2 is not limiting, a condition rarely met under ambient atmospheric CO2 concentrations. In most models, the Anet term of light saturated is commonly used (Damour et al., 2010).
 |
 |
|
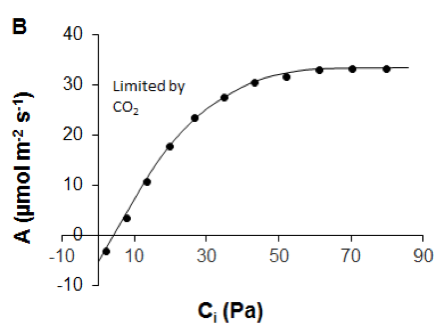
Figure 2.1.3.1 A Leaf-level light-response curve (solid line) showing the response of the net photosynthetic rate (A) to photosynthetic photon flux density (adapted from Lobo et al., 2013). Dark dots are for observed A. Slope (ϕ) of the curve shows maximum apparent quantum efficiency of the leaf (how efficiently solar energy is converted into chemical energy), Rd is the dark respiration rate, light compensation point is the light intensity at which respiration equals photosynthetic rate, Asat is the light-saturated photosynthetic rate. B A/Ci curve showing the response of net photosynthetic rate (A) to intercellular CO2 partial pressure (Ci). Dark dots are for observed A (data derived from Sharkey et al., 2007). |
|
One might also measure the response of CO2 uptake to intercellular mole fraction of CO2 (termed A/Ci) (Figure 2.1.3.1B) to separate the biochemical and stomatal limitations on photosynthesis (Long & Bernacchi, 2003). Ci refers to intercellular CO2 concentration. Intercellular CO2 is the main limiting factor for A only at low CO2 concentrations, while at higher CO2 concentrations other factors set limits to A as well (Long & Bernacchi, 2003). TheA/Ci response is determined by measuring A and transpiration at a series of ambient CO2 concentrations (Ca) and a defined leaf-air vapour pressure deficit (Long & Bernacchi, 2003).
Bronze standard
When a climate-controlled chamber is not available, one can make measurements of A under ambient conditions. Or, if an actinic light source is available, light saturation may be achieved without controlling for additional environmental factors known to influence A. These do not allow for analysis of metabolic controls of photosynthesis, but they do provide a survey of the breadth of A in response to variable conditions and may be well-suited to studies focused on the degree of inherent spatial and temporal variation in A.
Timing
The timing of a measurement is an important factor to consider. Measurements intended to derive maximum photosynthetic capacity should, ideally, be taken during the period of maximal photosynthetic activity of leaves, usually mid to late morning (Pérez-Harguindeguy et al., 2013), avoiding the period of afternoon depression when water status causes stomatal closure and thus limits CO2 supply. However, depending on location and species, the timing of maximal photosynthetic activity might differ. Asat should be measured during peak-growing season as timing of leaf-out and senesce can vary by species and if not considered could skew the results (Lim et al., 2007). For the calculation of whole day carbon assimilation of a plant, assimilation (A) at ambient light can be monitored from sunrise until sunset to calculate the daily sum of assimilated carbon, but it is very time-consuming and, for extrapolation over time, needs to be calibrated over different seasons and temperature conditions. Models can be applied to integrating over time and scaling across space leaf level A (see e.g. Patrick et al., 2009).
Selection of leaves
Commonly, light-saturated and fully developed canopy leaves are selected to allow for inter-specific species comparison of maximum photosynthesis rate, unless the aim is to compare the photosynthetic properties of leaves from different light conditions. This is relevant also in cases when you use an internal light source and adapt the leaf to saturating light as not all parameters (such as leaf structure, chlorophyll content etc.) which change under different light conditions and determine leaf photosynthetic rate, change during the minutes of acclimation. This is especially important for plants with thick leaves (Niinemets, 1999). With higher canopies (e.g. trees), it is important to consider the steep gradient in light conditions along the canopy when extrapolating leaf-level photosynthesis to whole-canopy photosynthesis (Niinemets et al., 2004). For narrow (e.g., needleleaf) leaves, several thin leaves can be placed side by side in the leaf chamber. If the measuring area is not fully covered with a leaf or leaves, considerable bias in the results may occur unless the surface area measured is adjusted. Commercial gas-exchange systems often provide special cuvettes or allow the adjustment of the sampling area.
Measurement conditions
Depending on the research question, one may use ambient environmental conditions v. more tightly controlled conditions. However, gas exchange measurements should not be done during windy weather or with wet leaves. For the measurements of Asat the light conditions must be saturating for at least 5–10 min prior to measurement (Pérez-Harguindeguy et al., 2013). In some cases, species with high sensitivity to water status will decrease photosynthetic activity following even a minor drought and thus, time since last rainfall should be considered where necessary (Medrano et al., 2002). Ambient CO2 concentrations are preferred, but may be manipulated when the effects of CO2 enrichment are of interest or for A/Ci curves. In manipulation experiments, as a gold standard, one should measure photosynthesis at both control and manipulated conditions. If time is limited, then as a bronze standard, photosynthesis in manipulated conditions should be measured as a priority.
Where to start
Boardman (1977), Farquhar et al. (1980), Long & Bernacchi (2003), Ögren & Evans (1993), Sharkey et al. (2007)
2.1.3.2 Special cases, emerging issues, and challenges
When measuring needleleaf photosynthesis (such as conifers), special chambers are preferred. To calculate the photosynthetic capacity on a leaf area basis, leaf area should be presented as the average projected total needle area (Grace, 1987). Leaf mass or leaf mass per area is sometimes used as the basis of comparison for complex leaf shapes. Ecosystem-scale estimates of photosynthesis (e.g., gross primary production) have been dealt with in protocol 2.3.3 Upscaling from the plot scale to the ecosystem and beyond.
Recently, a new technique was developed that captures full A/Ci curves within 5 min (Stinziano et al., 2017), which can potentially circumvent complications involving stomatal closure, changing water potential, enzyme activation, and chloroplast movement. It should be noted that such rapid measurements do not allow time for stomata to adjust to changes in CO2. The resulting A/Ci response is correct, but the stomatal adjustment to varied CO2 is not captured.
Historically A/Ci curves have dominated the literature, but the maximum carboxylation rate of Rubisco (Vcmax) is actually controlled by Cc, the CO2 concentration in the chloroplasts. Therefore, A/Cc curves should be preferred where possible (Sharkey, 2016). The difference between Ci and Cc is determined by the mesophyll conductance. Measurement of mesophyll conductance remains somewhat problematic (Pons et al., 2009), but intensive work is underway.
A relatively new and fast developing method used in photosynthesis research is the stable carbon isotope analysis of CO2 (Barbour et al., 2007). The ratio of 13C to 12C of CO2 entering and leaving the leaf chamber can be determined by a tunable diode laser (TDL) spectroscopy system, cavity ring-down absorption spectrometry, or quantum cascade laser. This enables the measurement of the leaf respiratory or photosynthetic CO2 flux and its associated carbon isotope composition (δ13CRl). The latter has the potential to allow partitioning of ecosystem respiration into various components (Tu & Dawson, 2005) enabling the tracing of carbon fluxes through plants and ecosystems at high temporal resolution and allowing very complex interpretations of ecosystem carbon losses (Kodama et al., 2011; Wehr et al., 2016). The stable isotope composition can also be used to infer intrinsic water-use efficiency, a measure of the trade-off between photosynthetic gains and transpiration losses (Marshall et al., 2007). Because the stable isotope ratio is determined at the chloroplast, estimates of mesophyll conductance can also increase the utility of this measurement (Wehr et al., 2016).
Chlorophyll fluorescence (see protocol 5.1 Chlorophyll fluorescence) measurements can be combined with gas-exchange measurements to study the functioning of the photosynthetic machinery in more detail and to infer the partitioning of energy between photosynthesis and respiration (Laisk & Loreto, 1996).However, the different parts of the leaf from where the CO2 signal and fluorescence signal comes, the alternative electron sinks, and other critical aspects need to be considered for interpretation (Yin et al., 2009).
2.1.3.3 References
Theory, significance, and large datasets
Ainsworth & Long (2005), Geider et al. (2001), Reich et al. (1998), Taiz & Zeiger (2010), Zhu et al. (2010), https://daac.ornl.gov/VEGETATION/guides/Leaf_Photosynthesis_Traits.html
More on methods and existing protocols
Hunt (2003), Lobo et al. (2013), Millan-Almaraz et al. (2009), Pérez-Harguindeguy et al. (2013), Sharkey (2016)
All references
Ainsworth, E. A., & Long, S. P. (2005). What have we learned from 15 years of free‐air CO2 enrichment (FACE)? A meta‐analytic review of the responses of photosynthesis, canopy properties and plant production to rising CO2. New Phytologist, 165(2), 351-372.
Ashraf, M., & Harris, P. J. C. (2013). Photosynthesis under stressful environments: an overview. Photosynthetica, 51(2), 163-190.
Atkin, O. (2015). New Phytologist and the ‘fate’ of carbon in terrestrial ecosystems. New Phytologist, 205(1), 1-3.
Barbour, M. M., McDowell, N. G., Tcherkez, G., Bickford, C. P., & Hanson, D. T. (2007). A new measurement technique reveals rapid post‐illumination changes in the carbon isotope composition of leaf‐respired CO2. Plant, Cell & Environment, 30(4), 469-482.
Boardman, N. T. (1977). Comparative photosynthesis of sun and shade plants. Annual Review of Plant Physiology, 28(1), 355-377.
Damour, G., Simonneau, T., Cochard, H., & Urban, L. (2010). An overview of models of stomatal conductance at the leaf level. Plant, Cell & Environment, 33(9), 1419-1438.
Evans, J. R., & Clarke, V. C. (2018). The nitrogen cost of photosynthesis. Journal of Experimental Botany, 70(1), 7-15.
Farquhar, G. D., von Caemmerer, S., & Berry J. A. (1980). A biochemical model of photosynthetic CO2 assimilation in leaves of C3 species. Planta, 149, 78-90.
Geider, R. J., Delucia, E. H., Falkowski, P. G., Finzi, A. C., Grime, J. P., Grace, J., … Platt, T. (2001). Primary productivity of planet Earth: biological determinants and physical constraints in terrestrial and aquatic habitats. Global Change Biology, 7(8), 849-882.
Grace, J. C. (1987). Theoretical ratio between “one-sided” and total surface area for pine needles. New Zealand Journal of Forestry Science, 17(2/3), 292-6.
Heber, U., Kaiser, W., Luwe, M., Kindermann, G., Veljovic-Javonovic, S., Yin, Z., … Slovik, S. (1995). Air pollution, photosynthesis and forest decline: interactions and consequences. In E.-D. Schultze, & M. M. Caldwell (Eds.), Ecophysiology of Photosynthesis (pp. 279-296). Heidelberg: Springer.
Hunt, S. (2003). Measurements of photosynthesis and respiration in plants. Physiologia Plantarum, 117(3), 314-325.
Jarvis, A. J., & Davies, W. J. (1998). The coupled response of stomatal conductance to photosynthesis and transpiration. Journal of Experimental Botany, 49, 399-406.
Kirschbaum, M. U. F. (2004). Direct and indirect climate change effects on photosynthesis and transpiration. Plant Biology, 6(03), 242-253.
Kodama, N., Ferrio, J. P., Brüggemann, N., & Gessler, A. (2011). Short‐term dynamics of the carbon isotope composition of CO2 emitted from a wheat agroecosystem–physiological and environmental controls. Plant Biology, 13(1), 115-125.
Laisk, A., & Loreto, F. (1996). Determining photosynthetic parameters from leaf CO2 exchange and chlorophyll fluorescence (ribulose-1, 5-bisphosphate carboxylase/oxygenase specificity factor, dark respiration in the light, excitation distribution between photosystems, alternative electron transport rate, and mesophyll diffusion resistance. Plant Physiology, 110(3), 903-912.
Lim, P. O., Kim, H. J., & Gil Nam, H. (2007). Leaf senescence. Annual Review of Plant Biology, 58, 115-136.
Lobo, F. D. A., De Barros, M. P., Dalmagro, H. J., Dalmolin, Â. C., Pereira, W. E., de Souza, É. C., … Ortíz, C. R. (2013). Fitting net photosynthetic light-response curves with Microsoft Excel—a critical look at the models. Photosynthetica, 51(3), 445-456.
Long, S. P., & Bernacchi, C. J. (2003). Gas exchange measurements, what can they tell us about the underlying limitations to photosynthesis? Procedures and sources of error. Journal of Experimental Botany, 54(392), 2393-2401.
Long, S. P., Farage, P. K., & Garcia, R. L. (1996). Measurement of leaf and canopy photosynthetic CO2 exchange in the field. Journal of Experimental Botany, 47(11), 1629-1642.
Marshall, J. D., Brooks, J. R., & Lajtha, K. (2007). Sources of variation in the stable isotopic composition of plants. In R. Michener, & K. Lajtha (Eds.), Stable Isotopes in Ecology and Environmental Science, (pp.22-60). John Wiley & Sons.
Medrano, H., Escalona, J. M., Bota, J., Gulías, J., & Flexas, J. (2002). Regulation of photosynthesis of C3 plants in response to progressive drought: stomatal conductance as a reference parameter. Annals of Botany, 89(7), 895-905.
Millan-Almaraz, J. R., Guevara-Gonzalez, R. G., Romero-Troncoso, R., Osornio-Rios, R. A., & Torres-Pacheco, I. (2009). Advantages and disadvantages on photosynthesis measurement techniques: a review. African Journal of Biotechnology, 8(25), a77738.
Niinemets, Ü. (1999). Components of leaf dry mass per area–thickness and density–alter leaf photosynthetic capacity in reverse directions in woody plants. New Phytologist, 144(1), 35-47.
Niinemets, Ü., Kull, O., & Tenhunen, J. D. (2004). Within‐canopy variation in the rate of development of photosynthetic capacity is proportional to integrated quantum flux density in temperate deciduous trees. Plant, Cell & Environment, 27(3), 293-313.
Ögren, E., & Evans, J. R. (1993). Photosynthetic light-response curves. Planta, 189(2), 182-190.
Pérez-Harguindeguy, N., Díaz, S., Garnier, E., Lavorel, S., Poorter, H., Jaureguiberry, P., … Cornelissen, J. H. C. (2013). New handbook for standardised measurement of plant functional traits worldwide. Australian Journal of Botany, 61(3), 167-234.
Patrick, L. D., Ogle, K., & Tissue, D. T. (2009). A hierarchical Bayesian approach for estimation of photosynthetic parameters of C3 plants. Plant, Cell & Environment, 32(12), 1695-1709.
Pons, T. L., Flexas, J., von Caemmerer, S., Evans, J. R., Genty, B., Ribas-Carbo, M., & Brugnoli, E. (2009). Estimating mesophyll conductance to CO2: methodology, potential errors, and recommendations. Journal of Experimental Botany, 60(8), 2217-2234.
Reich, P. B., Ellsworth, D. S., & Walters, M. B. (1998). Leaf structure (specific leaf area) modulates photosynthesis–nitrogen relations: evidence from within and across species and functional groups. Functional Ecology, 12(6), 948-958.
Sharkey, T. D. (2016). What gas exchange data can tell us about photosynthesis. Plant, Cell & Environment, 39(6), 1161-1163.
Sharkey, T. D., Bernacchi, C. J., Farquhar, G. D., & Singsaas, E. L. (2007). Fitting photosynthetic carbon dioxide response curves for C3 leaves. Plant, Cell & Environment, 30(9), 1035-1040.
Stinziano, J. R., Morgan, P. B., Lynch, D. J., Saathoff, A. J., McDermitt, D. K., & Hanson, D. T. (2017). The rapid A–Ci response: photosynthesis in the phenomic era. Plant, Cell & Environment, 40(8), 1256-1262.
Taiz, L., & Zeiger, E. (2010). Plant Physiology (5th ed.). Sunderland, MA: Sinauer Associates.
Tu, K., & Dawson, T. (2005). Partitioning ecosystem respiration using stable carbon isotope analyses of CO2. In Stable Isotopes and Biosphere–Atmosphere Interactions: Processes and Biological Controls (pp. 125-148). Academic Press.
von Caemmerer, S., & Farquhar, G.D. (1981). Some relationships between the biochemistry of photosynthesis and the gas exchange of leaves. Planta, 153(4), 376-387.
Wehr, R., Munger, J. J., McManus, J. B., Nelson, D. D., Zahniser, M. S., Davidson, E. A., … Saleska, S. R. (2016). Seasonality of temperate forest photosynthesis and daytime respiration. Nature, 534(7609), 680-683.
Yin, X., Struik, P. C., Romero, P., Harbinson, J., Evers, J. B., van der Putten, P. E., & Vos, J. A. N. (2009). Using combined measurements of gas exchange and chlorophyll fluorescence to estimate parameters of a biochemical C3 photosynthesis model: a critical appraisal and a new integrated approach applied to leaves in a wheat (Triticum aestivum) canopy. Plant, Cell & Environment, 32(5), 448-464.
Yue, X., & Unger, N. (2018). Fire air pollution reduces global terrestrial productivity. Nature Communications, 9, art5413.
Zhu, X. G., Long, S. P., & Ort, D. R. (2010). Improving photosynthetic efficiency for greater yield. Annual Review of Plant Biology, 61, 235-261.
Authors: Mänd P1, Stuart-Haëntjens E2, Marshall J3
Reviewers: Gough C2, Zinnert J C2
Affiliation:
1 Institute of Ecology and Earth Sciences, University of Tartu, Tartu, Estonia
2 Department of Biology, Virginia Commonwealth University, Richmond, USA
3 Department of Forest Ecology and Management, Swedish University of Agricultural Sciences, Umeå, Sweden