Authors: Matheny AM1, Bohrer G2
Reviewer: Lee H3
Measurement unit: kg H2O m-2 sapwoods-1; Measurement scale: plot; Equipment costs: €–€€; Running costs: €–€€; Installation effort: medium; Maintenance effort: medium to high; Knowledge need: high; Measurement mode: data logger
Transpiration is the largest component of the terrestrial hydrologic cycle (Jasechko et al., 2013; Schlesinger & Jasechko, 2014) and forms a critical intersection of the water and carbon cycles. Transpiration and the associated vegetation water fluxes (i.e. root-water uptake, recharge and discharge of biomass water storage, sap flux) are responsible for the rewetting of the atmospheric boundary layer and have been shown to drive cloud formation and downstream precipitation (Hesslerova & Pokorny, 2010; de Arellano et al., 2014). The energy associated with transpiration and evaporation, latent heat flux (LE), is a fundamental component of the Earth’s surface energy balance. Over densely vegetated areas, transpiration is the principal component of LE. Properly constraining estimates of transpiration, and thereby LE, is essential for solving the terrestrial surface energy budget and partitioning incoming solar energy into the constituent sensible, latent, and ground heat fluxes. Thermal cooling of the canopy associated with transpiration feeds back into the radiation budget through the Stefan-Boltzmann law and further alters surface-energy flux partitioning and Earth’s skin temperature (see Matheny et al., 2017b and references therein). Global climate change may be characterised by changes to precipitation and soil moisture dynamics and increased temperature and evaporative water demands – all affect and are affected by transpiration. Furthermore, changes to CO2 concentrations that drive climate change also change the water-use efficiency of plants, i.e. how much water is lost per unit of photosynthetic carbon uptake (Keenan et al., 2013). Measurements of transpiration at the ecosystem scale, and more particularly at the species level, are needed to understand how the ecosystem responds and feeds back to climate change.
While LE can be directly measured in the atmosphere above the canopy using the eddy covariance (EC) approach, these measurements are characteristic of a large measurement footprint (~1–10 km2) and include all evapotranspiration. EC measurements of LE are not specific to transpiration, nor can they distinguish plant species-specific contributions (Baldocchi, 2005). Sap flux (kg H2O m-2 sapwood area-1) is the most common individual-scale measurement of transpiration from woody plants, and can be scalable to the plot scale if measurements are sufficiently replicated. Sap flux measurements are widely accepted as indicators of the magnitude and patterns of transpiration (Poyatos et al., 2016). Such measurements are considered quantitative on a daily time step, but hourly inferences require correction for a time lag to account for the influence of the hydraulic capacitance of the vegetation (Granier & Loustau, 1994; Schäfer et al., 2000; Matheny et al., 2017a).
3.7.1 What and how to measure?
By definition, the term “flux” refers to a flow across an area (kg s-1 m-2), and in this case is specifically defined as the flow of sap (kg H2O s-1) per unit area of sapwood or active xylem (m2). This measure of sap flux is frequently referred to in the literature as sap flux density (Granier, 1987), while sap flow is typically presented as a rate (i.e. mm H2O s-1). Sap flux has historically been studied using dyes, radioisotopes, and salts as tracers but it is now most frequently measured using a thermal technique (Marshall, 1958).
Thermometric techniques allow sap flux to be monitored continuously in situ without the need for destructive sampling. The most common thermal monitoring techniques are the trunk segment or tissue heat balance ( Čermák et al., 1973; Kučera et al., 1977), the stem heat balance for very small stems (Sakuratani, 1981), heat field deformation (Nadezhdina et al., 1998), heat pulse velocity (Swanson & Whitfield, 1981; Dragoni et al., 2009), and thermal dissipation (Granier, 1987). While each method has its own set of strengths and limitations (see Wullschleger et al., 1998; Čermák et al., 2004; Steppe et al., 2010; and references therein), sap flux measurements are considered to be reliable estimates of vegetation water flux and transpiration (Poyatos et al., 2016). These methods differ fundamentally in the manner in which heat is applied and the timing of heat application, yet all are similar in that the rate of heat transfer is mathematically related to the velocity of water movement through the conductive woody tissue (Smith & Allen, 1996). In field experiments, it is recommended to measure at least five replicate trees per plot; if the site is heterogeneous (soil depth, slopes, multiple species, etc.) it is desirable to increase the number of measured trees.
Gold standard
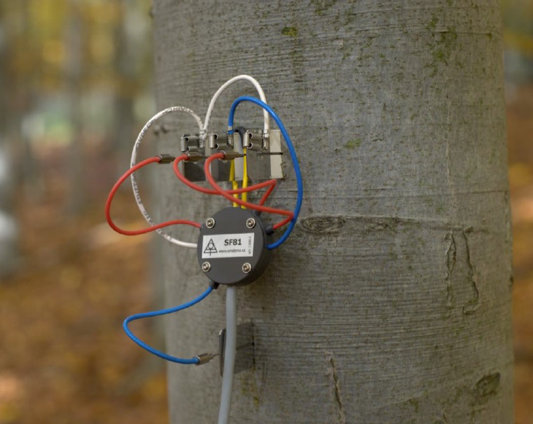
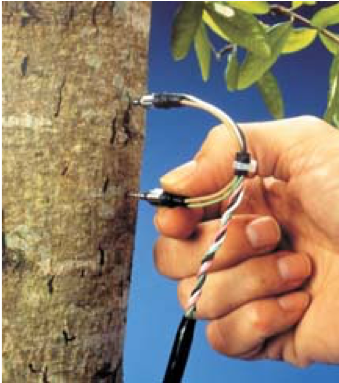
The trunk segment or tissue heat balance (THB) method requires no calibration and is frequently used as a standard against which other thermal tracer methods are evaluated and/or calibrated (Lundblad et al., 2001; Renninger & Schäfer, 2012). Commercially available THB sensors consist of three or more uniformly, continuously heated, plate electrodes and one unheated “reference” electrode located vertically below the central heated electrode (Figure 3.7.1 left). Temperature sensors located in the centre of each plate electrode measure temperature differences between the plates. The THB method calculates the temperature balance of the well-defined heated trunk volume in a manner that accounts for conductive transfer through the woody tissue and convective transfer due to water flow (Čermák & Nadezhdina, 2011). THB is suitable for large trees and can also be applied to smaller diameter stems (0.6–2 cm) using modified sensors (e.g. environmental measuring systems (EMS) “baby” sensors, Figure 3.7.1 right). Measurement inaccuracies have been reported during low flow conditions and in cases where the sensors are installed into stems with narrow sapwood (Čermák et al., 2004). THB sensors require more power input (0.6–1 W) than other methodologies.
 |
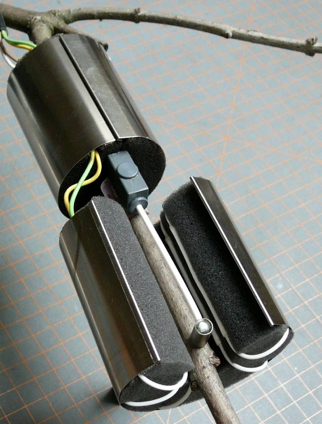 |
| Figure 3.7.1 THB sap flux sensor (left) and “baby” THB sensor manufactured by EMS (right). | |
Bronze standard
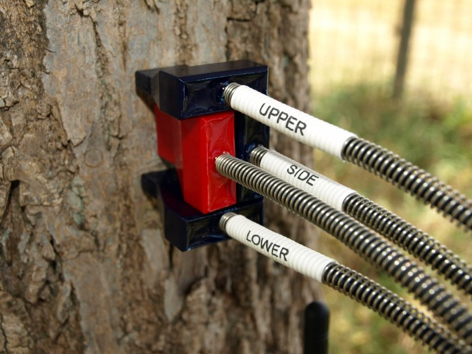
The heat field deformation method (HFD) (Nadezhdina et al., 2008) is a constant-heat technique that consists of one heated needle and three measurement needles (1–1.5 mm diameter), each containing several thermocouples. Generally, measurement needles are placed above, below, and to the side of the heater (Nadezhdina et al., 2012; Figure 3.7.2 left), although alternative configurations have been used (Čermák et al., 2004). Sap flow is calculated based on the ratio of temperature differences between the vertical and lateral thermocouple pairs. Commercially available HFD sensors contain multiple (up to ten+) thermocouples along their length and are ideal for monitoring sap flow at multiple radial depths (Nadezhdina et al., 2012). HFD sensors produced by ICT International require 0.06–0.08 W of electrical power per cm of sensor length (Nadezhdina et al., 2012).
The HFD method is capable of monitoring reverse flows and low flows without the need to assume a no-flow condition at night (Nadezhdina et al., 2012). In an intercomparison of sap flux measurement techniques, Steppe et al. (2010) demonstrated that the HFD method tends to underestimate sap flux and is very sensitive to sapwood depth. Results from Steppe et al. (2010) show the heat pulse velocity method (HPV) to be slightly more accurate than HFD, but only after an empirical correction for wounding effects (Swanson & Whitfield, 1981) is applied. Commercially available HPV sensors are typically low power and consist of a heater bracketed vertically above and below the temperature sensors (Burgess et al., 2001; Figure 3.7.2 right). Sap flux is calculated proportionally to the velocity of a heat pulse between the two temperature sensors (Marshall, 1958). Similarly to HFD, accuracy of HPV techniques can suffer during low flow conditions and they are prone to higher noise than HFD or thermal dissipation techniques (Steppe et al., 2010).
 |
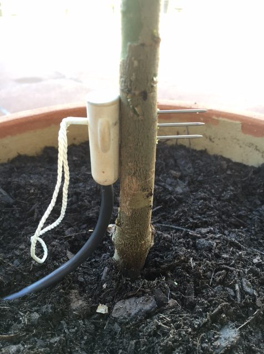 |
| Figure 3.7.2 HFD sensor HFD8-100 manufactured by ICT international (left) and HPV sensor manufactured by Edaphic Scientific (right). | |
The thermal dissipation (TD) method (Granier, 1987) is the most broadly used methodology for sap flux measurements (Poyatos et al., 2016). TD sensors consist of one unheated reference needle and one heated needle, each containing a thermocouple (Figure 3.7.3). The temperature difference between the upper heated needle and the lower unheated needle is empirically related to sap flux density (Granier, 1985). TD sensors are frequently manufactured in-house at very low cost and require a relatively low power use of 0.2 W, making them ideal for studies with high measurement replication. TD sensors are known to underestimate sap flux (Steppe et al., 2010; Renninger & Schäfer, 2012), but post-processing corrections for needle penetration into non-conductive wood (Clearwater et al., 1999) and nocturnal flow (Oishi et al., 2008) can improve accuracy. They are sensitive to radial and circumferential variation in sap flow rate within the stem. With careful data processing (available open-source through Oishi et al., 2016), this method can yield quantitative measurements without calibration in the lab prior to deployment. Measurements from TD sensors have been shown to align with data collected through porometery, whole-tree gas exchange, gravimetric water loss, above and below canopy EC measurements, and estimates from the Penman-Monteith equation (Renninger & Schäfer, 2012).
How to install and measure
Considerations of the methodology frequently include the purpose of the campaign (i.e. quantitative individual performance or upscaling), electrical power supply and consumption, maintenance capabilities, and the number of potential replicates. All sap flux measurement techniques are sensitive to installation location. Measurement points should be carefully selected and should not be in areas near knots or defunct branching points, as flow around these regions is generally altered. Conductive sapwood depth is known to vary circumferentially around the tree, and sap flow velocity is known to vary radially (Phillips et al., 1996). Typically, if only one measurement point is being made on an individual, sensors are installed on the north face (in the Northern Hemisphere; south face in Southern Hemisphere) of the stem to avoid direct heating by solar radiation. Typically sensors are covered by reflective insulation after installation as additional protection against external solar heating. In the case of multiple instrumentation points on a single tree, tertiary sensors can be located circumferentially or radially to account for variability in flux, or along branches to monitor lag time in flow rates. It is also generally recommended for all techniques, with the exception of heat balance methods, that measurements are made at multiple sapwood depths to account for radial variations in flow. Many commercially available sensors come with proprietary data logging systems (e.g. ICT international, EMS), while others (e.g. Dynamax, Edaphic Scientific) are compatible with common data loggers such as Campbell Scientific or HOBO. Proprietary loggers typically are installed adjacent to the sensor on the tree and are paired such that one logger records data from only one sensor. Non-proprietary loggers can be used to record data from multiple sensors simultaneously and are generally located at an easily accessible point central to the measurement plot. Data is usually recorded continuously at intervals of 15 minutes or less with 5 minutes being fairly typical. Depending on the species phenology measurements can be made year round or during, including immediately before and after, the growing season. The length of the measurements campaign is inherently dependent on the research question being explored, most typically campaigns last on the order of a few months to several years.
Where to start
Wullschleger et al. (1998) provide a good overview of water flux measurements in trees, while Steppe et al. (2010) provide comparisons of several of the leading methods. Guides for processing data are provided by Oishi et al. (2008, 2016). Matheny et al. (2014) provide guidance for collecting large numbers of replicates for scaling tree-level measurements to the plot scale.
3.7.2 Special cases, emerging issues, and challenges
In the case of HPV, and long-term measurement campaigns with other methods, the effects of wounding should be accounted for either numerically or through periodic sensor relocation during maintenance. Maintenance of sap flux instrumentation in the field is moderate to difficult: custom-made sensors require marginally more maintenance than commercial ones. Tropical environments with high wood-boring insect and rodent activity typically require maintenance that is more intensive, with a recommended minimum maintenance period of less than six months. Data collection for sap flux sensors is typically automated through a combination of data loggers and multiplexers, in the case of numerous replicates, with most measurements occurring on a 1–10 minute basis. Collected data are typically processed from the raw signal (usually mV) to sap flux through commercial or open-source software packages in MATLAB or R (Oishi et al., 2016). Upscaling sap flux measurements to the canopy or forest level can be accomplished using biometric and allometric relationships but this requires a large sample and representation of all significant species in the plot (Wullschleger et al., 1998; Matheny et al., 2014).
3.7.3 References
Theory, significance, and large datasets
Granier (1987), Poyatos et al. (2016), Steppe et al. (2010)
More on methods and existing protocols
Clearwater et al. (1999), Oishi et al. (2016), Phillips et al. (1996)
All references
Baldocchi, D. D. (2005). The role of biodiversity on the evaporation of forests. In M. SchererLorenzen, C. Korner, & E. D. Schulze (Eds.), Forest Diversity and Function: Temperate and Boreal Systems (Vol. 176, pp. 131-148). Berlin: Springer-Verlag.
Burgess, S. S. O., Adams, M. A., Turner, N. C., Beverly, C. R., Ong, C. K., Khan, A. A. H., & Bleby, T. M. (2001). An improved heat pulse method to measure low and reverse rates of sap flow in woody plants. Tree Physiology, 21(9), 589-598.
Čermák, J., & Nadezhdina, N. (2011). Instrumental approaches for studying tree-water relations along gradients of tree size and forest age. In F. Meinzer, B. Lachenbruch, & T. Dawson (Eds.), Size- and Age-Related Changes in Tree Structure and Function. Tree Physiology (Vol. 4, pp. 385-426). Dordrecht: Springer.
Čermák, J., Deml, M., & Penka, M. (1973). New method of sap flow-rate determination in trees. Biologia Plantarum, 15(3), 171-178.
Čermák, J., Kucera, J., & Nadezhdina, N. (2004). Sap flow measurements with some thermodynamic methods, flow integration within trees and scaling up from sample trees to entire forest stands. Trees, 18(5), 529-546.
Clearwater, M. J., Meinzer, F. C., Andrade, J. L., Goldstein, G., & Holbrook, N. M. (1999). Potential errors in measurement of nonuniform sap flow using heat dissipation probes. Tree Physiology, 19(10), 681-687.
de Arellano, J. V. G., Ouwersloot, H. G., Baldocchi, D., & Jacobs, C. M. J. (2014). Shallow cumulus rooted in photosynthesis. Geophysical Research Letters, 41(5), 1796-1802.
Dragoni, D., Caylor, K. K., & Schmid, H. P. (2009). Decoupling structural and environmental determinants of sap velocity Part II. Observational application. Agricultural and Forest Meteorology, 149(3-4), 570-581.
Granier, A. (1985). A new method of sap flow measurement in tree stems. Annales Des Sciences Forestieres, 42(2), 193-200.
Granier, A. (1987). Evaluation of transpiration in a Douglas fir stand by means of sap flow measurements. Tree Physiology, 3(4), 309-319.
Granier, A., & Loustau, D. (1994). Measuring and modeling the transpiration of a maritime pine canopy from sap flow data. Agricultural and Forest Meteorology, 71(1-2), 61-81.
Hesslerova, P., & Pokorny, J. (2010). Effect of Mau Forest clear cut on temperature distribution and hydrology of catchment of Lakes Nakuru and Naivasha: preliminary study. In J. Vymazal (Ed.) Water and Nutrient Management in Natural and Constructed Wetlands (pp. 263-272). New York: Springer.
Jasechko, S., Sharp, Z. D., Gibson, J. J., Birks, S. J., Yi, Y., & Fawcett, P. J. (2013). Terrestrial water fluxes dominated by transpiration. Nature, 496(7445), 347-350.
Keenan, T. F., Hollinger, D. Y., Bohrer, G., Dragoni, D., Munger, J. W., Schmid, H. P., & Richardson, A. D. (2013). Increase in forest water-use efficiency as atmospheric carbon dioxide concentrations rise. Nature, 499, 324-327.
Kučera, J., Čermák, J., & Penka, M. (1977). Improved thermal method of continual recording the transpiration flow rate dynamics. Biologia Plantarum, 19(6), 413-420.
Lundblad, M., Lagergren, F., & Lindroth, A. (2001). Evaluation of heat balance and heat dissipation methods for sapflow measurements in pine and spruce. Annals of Forest Science, 58(6), 625-638.
Marshall, D. C. (1958). Measurement of sap flow in conifers by heat transport. Plant Physiology, 33(6), 385-396.
Matheny, A. M., Bohrer, G., Vogel, C. S., Morin, T. H., He, L., Frasson, R. P. M., … Curtis, P. S. (2014). Species-specific transpiration responses to intermediate disturbance in a northern hardwood forest. Journal of Geophysical Research: Biogeosciences, 119(12), 2292-2311.
Matheny, A. M., Fiorella, R. P., Bohrer, G., Poulsen, C. J., Morin, T. H., Wunderlich, A., … Curtis, P. S. (2017a). Contrasting strategies of hydraulic control in two codominant temperate tree species. Ecohydrology, 10(3), e1815.
Matheny, A. M., Mirfenderesgi, G., & Bohrer, G. (2017b). Trait-based representation of hydrological functional properties of plants in weather and ecosystem models. Plant Diversity, 39(1), 1-12.
Nadezhdina, N., Čermák, J., & Nadezhdin, V. (1998). Heat field deformation method for sap flow measurements. In J. Cermák, & N. Nadezhdina (Eds.), Proceedings of 4th International Workshop on measuring sap flow in intact plants (pp. 72-92). Brno, Czech Republic: Publishing House of Mendel University.
Nadezhdina, N., Ferreira, M. I., Silva, R., & Pacheco, C. A. (2008). Seasonal variation of water uptake of a Quercus suber tree in central Portugal. Plant and Soil, 305(1-2), 105-119.
Nadezhdina, N., Vandegehuchte, M. W., & Steppe, K. (2012). Sap flux density measurements based on the heat field deformation method. Trees, 26(5), 1439-1448.
Oishi, A. C., Oren, R., & Stoy, P. C. (2008). Estimating components of forest evapotranspiration: A footprint approach for scaling sap flux measurements. Agricultural and Forest Meteorology, 148(11), 1719-1732.
Oishi, A. C., Hawthorne, D. A., & Oren, R. (2016). Baseliner: an open source, interactive tool for processing sap flux data from thermal dissipation probes. Software X, 5, 139-143.
Phillips, N., Oren, R., & Zimmermann, R. (1996). Radial patterns of xylem sap flow in non-, diffuse- and ring-porous tree species. Plant, Cell & Environment, 19(8), 983-990.
Poyatos, R., Granda, V., Molowny-Horas, R., Mencuccini, M., Steppe, K., & Martínez-Vilalta, J. (2016). SAPFLUXNET: towards a global database of sap flow measurements. Tree Physiology, 36(12), 1449-1455.
Renninger, H. J., & Schäfer, K. V. R. (2012). Comparison of tissue heat balance- and thermal dissipation-derived sap flow measurements in ring-porous oaks and a pine. Frontiers in Plant Science, 3, 9.
Sakuratani, T. (1981). A heat balance method for measuring water flux in the stem of intact plants. Journal of Agricultural Meteorology, 37(1), 9-17.
Schäfer, K. V. R., Oren, R., & Tenhunen, J. D. (2000). The effect of tree height on crown level stomatal conductance. Plant, Cell & Environment, 23(4), 365-375.
Schlesinger, W. H., & Jasechko, S. (2014). Transpiration in the global water cycle. Agricultural and Forest Meteorology, 189, 115-117.
Smith, D. M., & Allen, S. J. (1996). Measurement of sap flow in plant stems. Journal of Experimental Botany, 47(305), 1833-1844.
Steppe, K., de Pauw, D. J. W., Doody, T. M., & Teskey, R. O. (2010). A comparison of sap flux density using thermal dissipation, heat pulse velocity and heat field deformation methods. Agricultural and Forest Meteorology, 150(7-8), 1046-1056.
Swanson, R. H., & Whitfield, D. W. A. (1981). A numerical analysis of heat pulse velocity theory and practice. Journal of Experimental Botany, 32(1), 221-239.
Wullschleger, S. D., Meinzer, F. C., & Vertessy, R. A. (1998). A review of whole-plant water use studies in trees. Tree Physiology, 18(8/9), 499-512.
Authors: Matheny AM1, Bohrer G2
Reviewer: Lee H3
Affiliations
1 Department of Geological Sciences, Jackson School of Geosciences, The University of Texas at Austin, Austin, USA
2 Department of Civil, Environmental, and Geodetic Engineering, Ohio State University, Columbus, USA
3 NORCE Norwegian Research Centre and Bjerknes Centre for Climate Research, Bergen, Norway